Strand 2:
Technologically presented learning material
Bernard Winkelmann
Bielefeld, Germany
|
Plenary lecture: |
Developing a technologically rich scheme of work for 11 – 12 year olds in mathematics for electronic delivery |
|
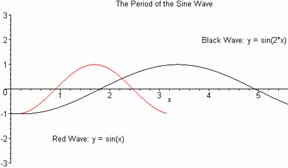
Animation - a tool for understanding polar coordinates |
|
|
Adding a sparkle to classroom teaching — Using Word, the Internet, and object-oriented software |
|
|
Design of content independent instructional systems |
|
|
Geometria: A tool for the production of interactive worksheets on the Web |
|
|
Creating and teaching online mathematics courses |
|
|
Teaching probability and statistics via the Internet |
|
|
A web-site for a mathematics support centre |
|
|
The collection of interactive solid figures and spatial situations in the Cabri - geometry |
|
|
Computer assisted assessment of proof = Proof of CAA — New approaches to computer assisted assessment for higher level learning |
|
|
Parametric nature of mathematics’ objects and computer environment |
|
|
The Communiversity Project delivers a restructured pre-calculus distance learning course |
|
|
Project Zero: Developing online material for mathematics teacher education |
|
|
Mathematics and the Internet |
|
|
Online mathematics teaching: The development of student instructor interaction |
3. Short overview of the contributions
1 The announcement
The following description of the subject of the strand was given in the announcement of the conference. The strand will be concerned with the following issues:
 criteria
for the use of technologically presented educational material;
criteria
for the use of technologically presented educational material;
designs
and methods that are specific to mathematics;
examples
of use, including internet, multi-media and hypertexts;
experiences,
implementation issues;
questions
of assessment and supervision of the students.
Design of hypermedia for mathematics uses the usual elements: texts, hypertext, spoken language, sounds, pictures, videos, diagrams, animations, but most important are interactive elements such as those created during the last two decades as parts of mathematical tool software: interactive texts in CAS, manipulable drawings in DGS, linked representations in function plotters or statistical software, simulations. Many brilliant examples have been demonstrated at the last two ICTMT conferences, but reflections on proper criteria how to use such tools for specific mathematical teaching aims have not been the focus. Here we encourage developers and analysts not only to describe and present good examples, but also to present their ideas about what makes a good example and what specific considerations are necessary especially for mathematics.
2 Current developments
In May 2001, after the deadline for contributions and abstracts and some exchanges between strands, 16 contributions to strand 2 were fixed. With most of the contributors I had e-mail-contacts regarding the appropriateness of the proposed themes, choice of examples, issues of presentations. In order to facilitate the exchange of ideas between contributors all contributors got the list of contributions, themes, abstracts, drafts, preliminary and final papers of all contributions to strand 2 as far as they were available to me.
After the deadline for the full papers those were exchanged in a similar manner and Peter Jones from Swinburne University of Technology, Australia was won to help in reviewing. Of course, it was too late to have a real critical review process since all announced contributions were de facto accepted, but we thought some hints could be useful to the authors and to the proceedings. In addition, some authors obviously had difficulties in the English language and in the end, were very glad of helpful advice from a native speaker.
At the conference in Klagenfurt two of the sixteen announced contributions had to be cancelled: Tatyana Byelyavtseva didn’t send a paper and was not present; Alfred Schreiber had sent full papers but couldn’t come due to some serious illness. Since his papers had been exchanged among the contributors of strand 2 and thereby influenced the discussions they are included in the proceedings.
During the conference the strand had its own auditorium equipped with very new presentation technology which all contributors had to get accustomed to but which, finally, turned out to be functional at the time of presentation. The presentations in the strand attracted between 4 and 45 visitors; the numbers were lowest on Tuesday afternoon when the parallel working groups started in addition to other strands and special groups. The audience was by no means constant; only a very small number of participants attended more than three presentations in strand 2. So a coherent discussion combining the views and results of different speakers in the strand could not develop; the idea of strands being a mini-conference in itself could not be realized in strand 2. In this case, the exchange of papers among contributors before the conference may have been counterproductive, since contributors already knew the contributions in strand 2 and understandably took the chance to hear other contributions.
Discussions after the presentations concerned requests for additional information, exchange of practical hints, clarification and further development of concepts and also some moderate criticism on some of the contributors‘ positions.
Most of the contributions were slightly modified after the conference, taking into account the suggestions of the reviewers and the discussions during the conference.
3 Short overview of the contributions
The contributions could roughly be divided into two clusters: those concentrating on the medium of transmission, mainly the internet (Priselac & Priselac, Stam & van Wijk, Lawson, Ehmke, Hector, Cooper, Hall, Smith) and those mainly concerned with questions of representation and software for mathematics teaching and learning (Clark-Jeavons & Hyde, Abboud, Butler, McCabe / Heal / White, Leischner, Nodelman, Schreiber). There is broad coverage of the last three points mentioned in the announcement; the first two points are only marginally dealt with in the contributions. (Abboud, Butler, McCabe / Heal / White, Leischner, Nodelman, Schreiber). There is broad coverage of the last three points mentioned in the announcement; the first two points are only marginally dealt with in the contributions.
Developing a technologically rich scheme of work
for 11 – 12 year olds in mathematics for electronic delivery
Alison Clark-Jeavons and Rosalyn Hyde
Chichester, Southampton, UK
1. A background to the mathsALIVE® resources
2. Frameworks for using ICT in mathematics teaching
6. Main teaching and pupil activities
7. Sample main activity for a lesson
8. Feedback, reflection, plenary
1 A background to the mathsALIVE® resources
The current climate in English and Welsh schools is one of investment in both the development and implementation of an Information and Communications Technology (ICT) strategy for teaching and learning to support the National Curriculum.
The government has invested heavily in putting ICT into schools through its National Grid for Learning programme (NGfL). Launched in 1998, the programme sets the following targets:
connect
all schools, colleges, universities, public libraries and as many community
areas as possible to the grid;
ensure
that serving teachers feel confident and are competent to teach using ICT
within the curriculum; and that librarians are similarly trained;
enable
school leavers to have a good understanding of ICT, with measures in place for
assessing their competence in it;
ensure
that general administrative communications between education bodies and the
Government and its agencies cease to be largely paper based;
make
Britain a centre for excellence in the development of networked software
content, and a world leader in the export of learning services.
A survey published in October 2000 indicated that 86% of primary and 99% of secondary schools were connected to the Internet (DfEE 2000a). However, of these schools, 38% of primary and 32% of secondary schools only had access via stand-alone computers with modems.
In the period 1999/2003 £230 million is being invested in training teachers and librarians in the effective use of ICT in schools. This money has been channelled from the government’s National Lottery proceeds via the New Opportunities Fund (NOF) set aside for public projects. The focus of this training is on the subject-based use of ICT. By mid January 2001 just over a quarter of a million teachers in maintained i.e. state schools had enrolled for NOF ICT training. As part of another government initiative, teachers of mathematics at Key Stage 3 (11-14 years) in maintained schools are also eligible to apply for a 50% subsidy (up to a maximum of £500) towards the purchase of a personal computer.
Schools decide individually how they spend monies received for developing ICT provision. Consequently there is a range of provision in mathematics classrooms with some departments equipped with computer suites, electronic whiteboards, data projectors and graphing calculators whilst others are yet to have their ICT dreams realised!
In 1998, the UK government commissioned the Numeracy Task Force to report on the relative underachievement of English children in international comparative mathematics surveys. (DfEE 1998). This led to the development of a National Numeracy Strategy (NNS), which was first implemented at Key Stage 1 (5-7 years), and Key Stage 2 (8–11 years) in September 1999 (DfEE 1999). In September 2000 NNS published a framework for Key Stage 3 (11-14 years). This is for implementation from September 2001. (DfEE 2000). The framework contains extensive references to the use of computer software (principally graphing packages, spreadsheets and dynamic geometry software) and graphing calculators.
The current shortage of mathematics teachers in the UK has also required the Department for Education and Employment (DfEE) to consider ways of supporting non-specialist teachers in the mathematics classroom.
2 Frameworks for using ICT in mathematics teaching
The Key Stage 3 Framework says that: “The main uses of ICT in mathematics in Key Stage 3 stem from:
The
use of calculators for calculating purposes;
Small
programs, such as number games or investigations in a particular context;
Programming
languages such as Logo or Basic, and the programming capabilities of a
graphical calculator;
General
purpose software, particularly spreadsheets, but also databases;
Content
free mathematics software, such as graph plotters, dynamic geometry software
and data handling packages;
ILS
(Independent Learning Systems), which provide practice in mathematical
techniques tailored to the needs of individual pupils;
Graphical
calculators and data loggers;
CD-ROM
and the Internet” (DfEE, 2000, 22)
Within the NNS Framework at Key Stages 1 and 2, the use of calculators is taught in Years 5 and 6. However the Teacher Training Agency (TTA) reports that primary school teachers generally use ICT for the following: as a free choice activity, as extension work, as a reward and for word processing, information retrieval or project work (TTA 1999). Also, ICT was not, in general, used for whole class teaching.
That report concludes that, “ICT offers the potential to improve standard of attainment in literacy and mathematics. Supporting teachers in making effective choices about when, when not and how to use ICT to strengthen their teaching needs to take account of a range of factors to be effective.”
The factors listed include matching activities to the curriculum learning outcomes, ensuring pupils have the necessary ICT skills, matching the starting point for development to teacher’s preferred style and approach, ensuring access to equipment and providing effective technical support.
A more curriculum-oriented approach is offered by the British Education and Communications Technology Agency (BECTa) in “Mathematics and IT – a pupil’s entitlement” which suggests that “pupils should be offered opportunities in six broad categories:
Learning from feedback
Observing patterns
Seeing connections
Working with dynamic images
Exploring data
Teaching the computer”
http://curriculum.becta.org.uk/
In their Curriculum Software Initiative, BECTa list those mathematics topics that they consider could benefit most from the use of ICT as being:
“Sequences
Graphs (point, line, loci, curve families)
Data handling and presentation
Geometry – Euclidean and transformation
Problem-solving by breaking down a complex task
into simpler sub-tasks”
http://www.becta.org.uk/technology/software/curriculum/reports/maths.html
3 The MathsALIVE project
At the British Educational Technology Trade exhibition (BETT) in January 2000, the newly appointed Minister for Learning and Technology, Michael Wills, outlined the need to develop mathematics materials that utilised the existing content in a high-tech format. The DfEE have supported such developments through conferences such as “Good practice in the Use of ICT in Mathematics, Science and Geography at Key Stage 3” where selected secondary teachers were invited to describe their pedagogy with ICT. (Wood 2001). The next stage was a formal process for the development of some pilot materials.
The Statement of Service Requirement for the competitive tendering process for the project from the DfEE suggests that there is an “absence of suitable, high quality material, deliverable with ICT…and whole courses with specific links to the new National Numeracy Strategy Framework” (p.5)
The DfEE declared two intentions for the project:
“to
produce material forming a year-long course suitable for students at Key Stage
3 in the subject of mathematics using information and communications
technology;
to
pilot their delivery, together with appropriate supporting material and
services, to a number of teachers and learners during the coming school year,
(2000 – 2001).”
There is also an intention by the DfEE that this project will stimulate the market to produce more, and better quality, interactive material and it is set against the background of teacher shortages and a drive to attain higher educational standards.
The DfEE has laid down a set of technical requirements for the project, which form part of the general requirements for learning materials produced for the NGfL. The technical requirements are regularly updated at http://challenge.ngfl.gov.uk/techannex.html.
The competition for the mathematics project was won by Research Machines plc. RM was founded in 1973 and is the United Kingdom's leading supplier of IT software, services and systems to the UK education market. RM has concentrated on making industry standard technologies accessible and appropriate in an educational environment. The company’s website states, “RM's passion is education and its aim is to explore and exploit the potential of IT to improve educational standards.” (http://www.rm.com/)
The full project group consists of:
the RM team, which includes teachers;
3T software company;
the educational advisory group (Don Passey, Ruth
Merttons and Adrian Oldknow);
the writing group (co-ordinated by Afzal Ahmed
at University College Chichester (UCC);
the training and support group which includes
Ros Hyde of The Mathematical Association (MA) and Adrian Oldknow;
the pilot teachers’ group, most of whom are very
inexperienced in using ICT in their teaching;
an external evaluation team (via BECTa)
internal evaluation by Don Passey.
The pilot project, entitled mathsALIVE, began in January 2001 with 20 schools and a group of distance learners. The mathsALIVE project is intended to be both a form of research into the potential use of ICT in teaching mathematics and a means of increasing the electronic learning resources and materials available to schools. The standard mathsALIVE classroom is equipped with the following:
Hardware:
An interactive electronic white board
(Smartboard);
Ceiling mounted data projector;
Teacher’s laptop and printer;
Three computers with internet connection and
printer;
15 Texas Instruments TI-73 graphing calculators
with Number Line application;
TI73 Viewscreen + teacher unit and calculator
based ranger (CBR);
Overhead projector (OHP).
Software:
Microsoft Office 2000 (MS Word with equation
editor, MS Excel, MS Powerpoint, MS Outlook Express);
MS Internet Explorer 5;
RM Easiteach 1.5;
The Geometer’s Sketchpad;
TI-73
Graphlink;
TI
Interactive!;
MSW LOGO;
Apple QuickTime Player 4.1.2;
Macromedia Flash Player 4.0;
Macromedia Shockwave Player 8.0.
RM mathsALIVE management system
RM approached The Mathematics Centre, University College Chichester (UCC) to assemble a consultant authoring team for the project. The Mathematics Centre at UCC is internationally renowned for its innovative approaches to all aspects of mathematics teaching and learning, promoting the use of effective questioning to further mathematical understanding. The Centre has co-ordinated major curriculum research projects (RAMP 1989) and has an established bank of both human and written resources from which to select. This combined with the Centre’s experience in working in an advisory capacity to Local Education Authorities (LEA) and schools made it an ideal partner for the project.
The structure of the mathsALIVE electronic management system required that each activity be assigned a main learning objective and one sub-objective, taken from the NNS. This constraint provided a challenge for the authors, particularly where a rich mathematical activity spanned a number of objectives. Table 1 shows the list of main and sub-objectives for just one unit of work called Calculations 1.
|
|
Calculations 1 |
||
|
Mental and Oral Starters |
Draft Key Stage 3 page reference |
Main objective |
Sub-objective |
|
20–25 Mental methods |
Recall multiplication and division facts to 10 x 10 |
Multiplication facts |
|
|
20–25 Mental methods |
Recall multiplication and division facts to 10 x 10 |
Division facts |
|
|
20–25 Mental methods |
Recall multiplication and division facts to 10 x 10 |
Multiplication and division facts |
|
|
8–9 Properties of numbers |
Recognise multiples and use tests of divisibility |
Recognise multiples |
|
|
8–9 Properties of numbers |
Recognise multiples and use tests of divisibility |
Divisibility tests |
|
|
20–25 Mental methods |
Multiply and divide a two-digit number by a one-digit number |
Multiply a two-digit number by a one-digit number |
|
|
20–25 Mental methods |
Multiply and divide whole numbers by 10, 100 |
Multiply and divide whole numbers by 10, 100 |
|
|
Teaching
Unit - |
2–7 Place value, ordering and rounding |
Order, add and subtract positive and negative numbers in context |
Order positive and negative numbers |
|
20–25 Mental methods |
Consolidate and extend mental methods of + and - of whole numbers, extend to decimals |
Revision of mental calculations with 2 two-digit numbers |
|
|
20–25 Mental methods |
Consolidate and extend mental methods of + and - of whole numbers, extend to decimals |
Mental calculations with 2 two-digit numbers with 1 decimal place |
|
|
26–27 Written methods |
Consolidate efficient written methods of + and - of whole numbers, and extend to decimals |
Addition of decimals |
|
|
26–27 Written methods |
Consolidate efficient written methods of + and - of whole numbers, and extend to decimals |
Subtraction of decimals |
|
|
2–7 Place value, ordering and rounding |
Order decimals in different contexts |
Order decimals in different contexts |
|
|
2–7 Place value, ordering and rounding |
Order, add and subtract positive and negative numbers in context |
Add and subtract positive and negative numbers |
|
|
2–7 Place value, ordering and rounding |
Understand and use decimal notation and place value |
Place value 0.001 to 1000000 |
|
|
2–7 Place value, ordering and rounding |
Understand and use decimal notation and place value |
Add subtract 0.1, 0.01 |
|
|
2–7 Place value, ordering and rounding |
Understand and use decimal notation and place value |
Multiply and divide any number by 1,10, 100, 1000 |
|
|
28 Calculator methods |
Interpret the display on a calculator in different contexts |
Interpret money |
|
|
28 Calculator methods |
Plan and carry out calculations using a calculator |
Using a calculator + - ´ ¸ |
|
|
30-38 Solving problems |
Choose and justify an appropriate and efficient method |
Choose and justify methods |
|
|
30-38 Solving problems |
Explain methods and reasoning, orally and in writing |
Explain calculation methods |
|
|
29 Checking results |
Judge whether an answer is reasonable and check results |
Estimating answers |
|
|
29 Checking results |
Judge whether an answer is reasonable and check results |
Equivalent calculation |
|
|
30-38 Solving problems |
Solve problems and puzzles in a variety of contexts |
Solve problems involving number |
|
Table 1: Main and sub-objectives for the unit of work called Calculations 1 (pages refer to National Numeracy Strategy Draft)
The NNS proposes the adoption of a teaching style in secondary schools, which it developed for primary schools. This is based on a “three part lesson”, which consists of a mental/oral starter (5 – 10 minutes), the main teaching activity (25 – 40 minutes) and a plenary session (5 – 15 minutes).
The authoring team then began designing lessons that used ICT in an appropriate and effective way using a variety of teaching and learning styles and approaches. The team wanted to encourage the imaginative use of the ICT resources provided, such as the use of the Number Line application on the TI-73 graphing calculator, as part of a mental/oral starter.
The authoring team were aware that there is an issue regarding what and how pupils record written work when working in an ICT environment and, in designing the activities, wanted to create opportunities that were integral to the activity. This could also be in the form of brainstorming ideas and written strategies and building in activities that involved group presentations and displays. In doing this, the team was hoping to influence the ways that teachers would assess the pupil’s work, as there is a danger that, in a tightly objective driven lesson, teachers might choose a more traditional form of assessment, such as an exercise of ten questions.
The NNS approach at Key Stage 3 can be interpreted through rigid whole-class teaching, but the writing team have sought to counteract that by offering a variety of creative classroom management models, e.g. a group of pupils using the three class computers, whilst others used the TI-73 graphing calculators and the teacher worked with a small group using the laptop computer, data projector and Smartboard.
The scheme as a whole includes:
teacher
access to the mathsALIVE website, from where they plan and launch lessons,
exchange ideas, access technical support;
the
lesson activities which include videos, custom written games and computer
simulations;
teacher’s
electronic mark book;
teacher’s
notes to accompany each activity;
pupil
worksheets;
homework
activities, which pupils can access independently from a mathsALIVE® computer;
on-line
and off-line assessments;
pupil
access to the mathsALIVE website, from where they access homework, additional
activities and resources.
4 Planning lessons
When a teacher plans a mathsALIVE lesson for her class, the starting point is to follow the flowchart provided.
Obtain the “unit objectives” sheets for the half term from the mathsALIVE Burning Issues forum on the website
↓
Compare the teaching time available
with the length of time allocated to the unit of work
↓
Work out the number of hours for each unit
↓
Plan the
Objectives for the unit into lessons to match the time plan. Miss out the
objectives that your students have already covered and highlight those
objectives that will be extension work.
Remember to plan in the key objectives
↓
Print the unit plan, then in “Advanced Edit” create new lessons or alter existing lessons remembering to include a plenary activity to each lesson
↓
Delete any unwanted lessons from the electronic lesson plan
↓
Print the
revised Unit Plan and check the lesson plans using
“Validate Unit”
Review if necessary
There are more activities provided that there is time available, to encourage teachers to take the previous learning of their pupils into consideration when planning a lesson. The teacher has the choice of the activities and needs to choose carefully and appropriately for her pupils. As some of the activities are so enjoyable, the pupils could be reluctant to move on to the next activity and there could be a danger that pupils are not challenged sufficiently.
The teacher is able to select activities to create a lesson away from the class and save it to use with the pupils in the lesson time, as well as preparing any appropriate pupil resources. The teacher can print out the activity notes, and request on-line support with any technical problems in advance of the lesson.
5 Mental and oral starters
These are intended to be offered through whole class teaching at the teacher’s direction. The general aims are to rehearse, sharpen and develop mental and oral skills and to revisit previously taught skills following a planned programme of short mental and oral activities. Pupils might be encouraged to use paper and pencil to record responses if appropriate.
An activity using the TI-73 Viewscreen - Fractions and percentages with the TI-73
|
|
|
Fig. 1 |

In this activity the Numberline application for the TI-73 graphics calculator is used to stimulation discussion and understanding about converting between fractions and decimals. The application shows a number line that can show any two of fractions (either simplified or not), decimals and percentages on a number line. The teacher’s notes for the activity encourage the use of carefully structured questions to help pupils develop an understanding of the equivalence between fractions and percentages.
Graphics calculators are used in a number of ways in the mathsALIVE scheme. As well as being used to analyse data, plot graphs, calculate with numbers etc., they are used to run small programs, for example to practice estimating angles. Another use the authors have been developing is for whole class teaching, as in the above example, where the teacher uses one calculator and the viewscreen to work with the whole class.
An activity using Easiteach - Factor flowers
|
|
|
Fig. 2 |
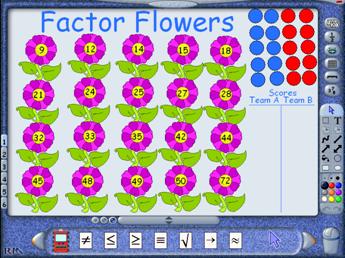
This activity uses the RM software Easiteach. Pupils practice the quick recall of factors of numbers in the context of a team game. It relates to the objective “Recognise multiples, factors and primes (less than 100)”. Each team takes it in turn to throw two dice and add the scores. If the number is a factor of a number on a flower, they cover that flower with one of their coloured counters and score the total of their dice as their team’s score. There are number of variations and possible scoring systems to encourage pupils to consider strategies and to help them to use the higher multiples of the numbers on the flowers.
The Easiteach software allows teachers to prepare screens in advance for lessons. They have access to a variety of images and tools to do this and can also import images from other sources, such as graphing calculator screen shots. By using a Smartboard and techniques such as hiding, revealing or moving information, pupils are able to interact with the mathematics and, in a sense, ‘touch’ it.
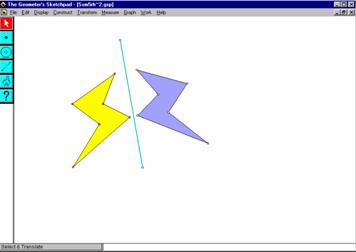
An activity using The Geometer’s Sketchpad-Estimating acute, obtuse and reflex angles
|
|
|
Fig. 3 |

This activity is related to the objective “Measure and draw lines to the nearest millimetre and angles to the nearest degree, including reflex angles”. It is intended as a short teacher-led activity for the whole class. The point is dragged to create an angle and pupils are asked to estimate the size of the angle and whether it is acute, obtuse or reflex. In this way pupils are encouraged to consider the size of an angle before they draw or measure it, and to consider angle as a measure of turn.
An activity using custom written software - Ordering angles
|
|
|
|
Fig. 4a |
Fig. 4b |
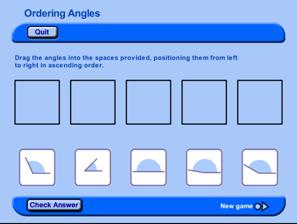
This activity relates to the mathsALIVE objective “Estimate and order acute and obtuse angles”. Pupils are asked to sort five angles according to size. They can choose angles in the following ranges: 0-90o, 0-180o, 0-360o. The activity uses a piece of custom-written software, which allows the answer to be checked, and displays both the size of the angle and whether it is acute, obtuse or reflex. With careful questioning from the teacher, pupils can gain a sense of angle as a measure of turn and begin to estimate the size of angles, before moving on to measuring them with a protractor. This activity is also suitable for use by groups of pupils on the stand-alone computer.
6 Main teaching and pupil activities
In the main part of the lesson, pupils work as a whole class, groups, pairs or individuals. This part of the lesson may include the introduction of a new topic, consolidation or extension of previous work, developing new vocabulary or notation, using and applying concepts and skills and assessment and review of what has happened.
An activity using The Geometer’s Sketchpad - Polygon mirrors
|
|
|
Fig. 5 |
This activity forms part of the work on the objective “Reflect 2-D shapes in given mirror lines and recognise line symmetry”. It is intended to be a short activity for individual pupils using a computer. Pupils can drag both the mirror line and a polygon to see how this affects the reflection. They are also asked to drag a polygon so that they see the effect of one side of the polygon lying on the mirror line and so that they see what happens when the mirror line crosses the polygon. By interacting with the geometric situation dynamically, pupils gain a sense of how moving the mirror line or a polygon affects a polygon’s reflection.
The Geometer’s Sketchpad is generally used within mathsALIVE to develop simple interactive images for pupils and teachers to manipulate. Very few schools in England make much use currently of dynamic geometry with pupils of this age, and few teachers have used the software, so the activities developed for mathsALIVE aim to take this into consideration as well as helping teachers and pupils develop appropriate skills.
A simulation activity - Stock market game
|
|
|
Fig. 6 |
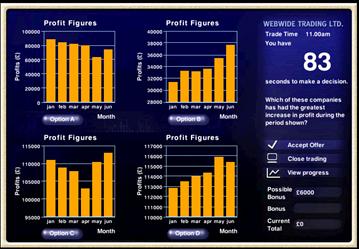
This simulation is a custom-written piece of software for use by individual pupils designed to help them interpret diagrams and graphs by pretending they are trading on the stock market. Pupils are presented with a set of graphs, which they need to examine carefully before choosing the one they think is best either in terms of profit made, or greatest increase in profits or share price. The game is played against the clock, with quick correct answers leading to a bonus being awarded and the software also features a high scores table.
An activity using TI Interactive! - Phone a friend
|
|
|
Fig. 7 |
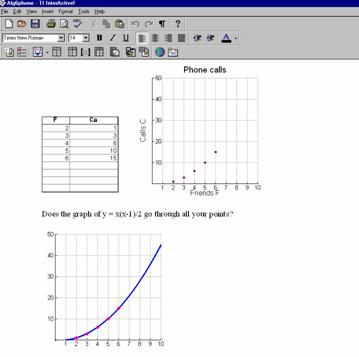
This activity is based on the classic ‘Handshakes’ investigation leading to the triangular numbers sequence and formula. TI Interactive! is used to provide an interactive worksheet that the teacher and pupils can add to and see the corresponding table and graph change as they do so.
7 Sample main activity for a lesson
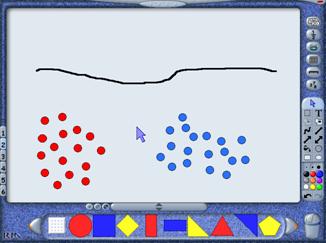
One of the Year 7 mathsALIVE main objectives is to “understand the relationship between ratio and proportion, and use ratio and proportion to solve simple problems” with the sub-objective “ratio expressed as n:m” which has traditionally been a mathematical concept that pupils have found difficult. The authors decided to use a practical approach with the Easiteach software to enable pupils to explore the concept of ratio.
|
|
|
Fig. 8 |
The touch-sensitive property gives pupils the opportunity to come to the Smartboard and physically drag each “bead” to produce a pattern in the given ratio. The software is not interactive in the sense that it gives feedback as to whether the pupil is producing a correct bead arrangement. It is the responsibility of the teacher to feedback on errors and misconception, although in reality, the observing class are providing this feedback.
The author chose not to state which colours should be in the given ratio and in the lesson notes for the teacher, suggested questioning routes were:
In
pairs, can you discuss how you could put the beads on the string?
From
the information you have been given, does it matter which colours we choose?
How
many colours will you use?
Will
you need all the beads of your chosen colours?
How
many different colour combinations could you choose?
The emphasis here is to keep the questioning open to allow pupils to develop their own understanding of the concepts and make mathematical connections, stimulating discussion between pupils and teacher.
|
|
FDPRP 3Investigating Ratio - stringing beads. |

|
Worksheet |
|
|
|
|
|
Fig. 9 |
You will need a red pen and a blue pen for this activity.
Design a regular pattern for stringing the beads.
When you have finished your pattern you will need to record the total number of red beads and blue beads that you have used.
|
|
number of red beads |
number of blue beads |
total number of beads |
|
|
|
|
|
|
|
|
|
|
|
|
red:blue |
blue:red |
|
|
ratio |
|
|
|
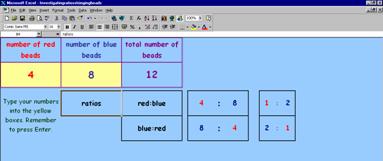
You can check your calculations using the MS Excel file “Investigating ratios – stringing beads”
The Excel spreadsheet file allows the students to type in their numbers to check their ratio of red beads to blue beads.
|
|
|
Fig. 10 |
Each of the activities have a set of accompanying teacher’s notes which identify the activity objectives of the activity and accompanying key vocabulary. The teacher is also given key questions to ask the students throughout the activity. An example set of notes to accompany the “Investigating Ratios - Stringing Beads” activity follow:
|
FDPRP 3 |
¹ 30 minutes |
|
|
Investigating ratios - stringing beads |
||
Activity notes
|
Objectives: |
§ Understand the relationship between ratio and proportion, and use ratio and proportion to solve simple problems. |
||
|
Sub-objectives: |
§ use ratio |
||
|
Type of activity: |
This Easiteach activity introduces the concept of ratio in relation to stringing beads using repeating patterns and investigating the ratio of the colours. There is an accompanying pupil worksheet. |
||
|
Vocabulary: |
Equivalent factor |
lowest common multiple |
ratio |
Introduction
This Easiteach activity introduces the concept of ratio in relation to stringing beads using repeating patterns and investigating the ratio of the colours. The accompanying pupil worksheet and Excel spreadsheet provide opportunities for independent working.
Classroom organisation
Initially, the teacher will need to introduce the task using the Smartboard and Easiteach file. The pupils will need the accompanying worksheet to investigate further and access to the excel file on the classroom computers when checking their work. The Excel file can also be used in the plenary session.
Resources
The pupil Word worksheet “Investigating ratios – stringing beads” will need to be given out to each pupil and the Excel file “Investigating ratios – stringing beads” opened onto the classroom computers.
Activity
The following table provides instructions for using the different pages of the Easiteach file and key questions to ask the students as you work through each one.
|
Page |
Instructions |
Key questions to ask |
|
1 |
This page shows an empty “string” and some “beads” of different colours and variable quantities. The question “How could you thread the beads onto the string so they are in the ratio 3:1 ?” You will need to remind pupils of the colon notation and what it means. The question is very open as it does not indicate which colours to use and in what quantities. Encourage the pupils to consider possible amounts. Give the pupils some time to come up with some possible ideas and invite them up to the board to share their designs. |
§ Is the question clear? § Why not? § If we decided that there would be more red than blue, now can you design the string of beads? |
|
2-3 |
These pages are identical to page 1 to give space for the pupils to share their designs. |
|
|
4 |
This page introduces the class activity and the pupils will need a copy of the accompanying worksheet. The pupils are asked to design their own bead pattern using red and blue beads. You will need to discuss the need for complete “repeats” of the pattern and encourage the pupils to use their imagination. When they have completed their design, they will need to record how many red and blue beads they used and work out the ratio of the colours. They can then use the Excel spreadsheet to check their results. |
§ If your pattern is NOT going to be random, what will you have to make sure that you do? § What do you notice about the TOTAL number of each coloured bead and the ratio that you chose to use? |
|
5-6 |
These pages are identical to page 4 to give space for the pupils to share their designs. |
|
Ideas for extension work
The obvious extension activity is to allow the pupils to have more than two colours. Alternatively, pose some questions such as “If you have 6 yellow beads, 24 red beads and 36 blue beads and you are going to use them all, what designs can you come up with?”
Plenary
Discuss the need for clear mathematical language. If we are talking about a ratio, we need to know which information each number is linked with.
Also, if something has been shared in a given ratio, the total number of each object will be in the same or equivalent ratio.
Use some of the patterns that pupils have designed to illustrate these points.
Copyright © 2000 Research Machines plc
8 Feedback, reflection, plenary
In the last five to ten minutes of each lesson, the teacher will work with the whole class for a plenary session on the activities carried out during the lesson. This may include sorting out any remaining misconceptions, rounding off and summarising the lesson, identifying key ideas and what to remember, making links to other work and setting homework. It can also be used to advance the students’ mathematics and introduce new concepts to be developed further in subsequent lessons.
9 Homework activities
The homework activities complement the learning objectives of the lesson and may require the pupils to use the Internet to access on-line activities both within the mathsALIVE website student area and elsewhere on the web. This might involve research, investigation or consolidation of mathematical concepts.
10 Assessment opportunities
The KS3 Mathematics strategy emphasises the development of students’ informal methods through discussions and jottings, which will change the nature of what the students record. Teachers will therefore be forming their assessments based on the students’ oral and written responses to key questions, extended tasks and problem solving activities. A strong emphasis has been placed on teacher’s analysis of the students’ misconceptions and that these misconceptions are addressed in future lessons. The effective electronic recording of student progress data is an area for development in schools generally, as well as the mathsALIVE pilot project.
The mathsALIVE scheme has formal end of unit assessments, both electronic and paper based, which provides teachers with numerical data for interpretation that reflects the student’s performance. The authoring team has considered how an electronic assessment tool could be developed that informed teachers of common student misconceptions from an interpretation of students’ incorrect responses. The pilot scheme is aimed at middle ability Year 7 students and it is the responsibility of the teacher to ensure to ensure that the needs of individual students are met.
11 Evaluation
At the time of writing, the project is still in pilot, however initial responses indicate that there has been a positive impact on the teaching and learning of mathematics within the mathsALIVE pilot classes. This has been identified through the formal evaluation process and informal classroom observations. The following aspects have been identified from the two perspectives:
|
Teachers are:
|
Students are:
|
The pilot schools have also commented that their involvement in the project has had a positive effect on recruitment and retention.
12 Summary
The mathsALIVE! pilot scheme is consistent with the findings of the Cockcroft Report (1982) and curriculum development initiatives such as RAMP (1989). The resources produced as outcomes provide an excellent basis for current and future developments. Professional organisations such as the Association of Teachers of Mathematics (ATM) and The Mathematical Association (MA) have also contributed to the models of pedagogy and resources for teaching and learning. The curriculum orders and guidance provided by the National Curriculum and Key Stage 3 Mathematics Strategy still provide for teacher autonomy. The opportunities for curriculum development projects such as mathsALIVE! stimulate the continuous dialogue within the mathematics education community.
The project is consistent with the developments of ICT within mathematics education. The advice produced by BECTa (1997, 1998, 1999), NCET(1994), Higgo (1992) and TTA(1999) have provided models of good practice. The impact of which has been the development of materials for a range of software and peripherals. The authoring team was well supported by the availability of materials for the chosen software: The Geometer’s Sketchpad, TI Interactive! the TI-73/TI-83+ graphing calculators and CBR.
The authors are not proposing that this is rocket science! - it builds on tried and tested innovations. A primary objective of the project is to motivate teachers to want to use materials that have already been developed. Decisions relating to the choice of technology, i.e. electronic whiteboard, data projector (beamer), etc. reflect the most recent innovations and advice in the use of ICT in mathematics education. The project also aims to encourage teachers to use technology in managing resources and planning lessons, as well as providing materials for the use of both teachers and students. The mathsALIVE project has come at a time when schools are facing the need to change in response to the ICT and mathematics initiatives.
In conclusion, the underlying philosophy of the mathsALIVE pilot follows the continuum of the best pedagogy in mathematics education and maximises the use of the current tools that are available to teachers and learners.
References
Ahmed, A et al (1987) Better Mathematics. HMSO.
ATM/MA (1994) The IT Maths Pack. NCET.
BECTa (1997) A pupils entitlement in Mathematics. BECTa, http://curriculum.becta.org.uk/
BECTa (1998) Data-capture and modelling in mathematics and science. BECTa
BECTa (1999) Curriculum Software Initiative – mathematics. BECTa,
http://www.becta.org.uk/technology/software/curriculum/reports/maths.html
Cockcroft, W. (1982) Mathematics Counts. HMSO.
DfEE (1998) The Implementation of the National Numeracy Strategy: The Final Report of the Numeracy Task Force. DfEE
DfEE (2000) National Numeracy Framework for Key Stage 3. DfEE.
DfEE (2000a) Statistics of education: Survey of ICT in Schools, England 2000. DfEE.
Higgo, J. (1992) Not the National Curriculum – The ideal geometry curriculum? MA
Oldknow, A and Taylor, R. (2000) Teaching Mathematics with ICT.
Continuum Teacher Training Agency. (1999) Ways forward with ICT. TTA.
Wood, J. (1991) Good Practice in the Use of ICT. RM plc, Oxford.
Glossary
|
BECTa: |
British Education&Communications Technology Agency |
DfEE: |
Department for Education and Employment |
|
ICT: |
Information and Communications Technology |
LEA: |
Local Education Authority |
|
MA: |
The Mathematical Association |
NCET: |
National Council for Educational Technology |
|
NGfL: |
National Grid for Learning |
NNS: |
National Numeracy Strategy |
|
NOF: |
New Opportunities Funding |
OHP: |
Overhead Projector |
|
RM: |
Research Machines |
TTA: |
Animation - a tool for understanding polar coordinates
May C. Abboud
Beirut, Lebanon
Students in undergraduate classes have a great deal of difficulty in plotting graphs of functions given in polar coordinates. In previous work done, animation was used as a tool to understand how a linear transformation affects the graph of a function of a real variable, and here I am extending this work to enable students to better understand polar coordinates and the relationship to cartesian coordinates. Polar coordinates pose cognitive difficulties not experienced by students in their study of functions of a real variable, one of which is the multiple representation of points. A Computer Algebra System with the powerful built-in graphics capabilities can be used to enhance the learning of these concepts. In this paper we use "Mathematica" to develop tools for animation of functions in polar coordinates in order to help the student ovecome the cognitive obstacles and help them to understand how the graph of a function is being traced in terms of the variation of the polar angle.
1 Introduction
Students in undergraduate classes have a great deal of difficulty in plotting graphs of functions in general and more so functions defined in terms of polar coordinates. The study of polar coordinates poses cognitive difficulties not experienced in the case of functions of a real variable. This difficulty arises from the fact that points have multiple representations whereas in the students' previous experience there is only way in which points can be represented. Another matter that causes difficulty is the fact that in polar coordinates, the independent variable cannot be represented statically as in the case of cartesian coordinates, whose values are points on a line. To represent a point in polar coordinates, one has to specify the polar angle by an arc starting from the positive x-axis representing the angle and then the value of r going in the direction of the ray if r is positive, going in the opposite direction if r is negative. In other words it is a dynamic process that defines the polar angle. This is quite different form representing the set of all real numbers as points on a line, namely the x-axis. The relationship between the graph in polar coordinates and in cartesian coordinates is another confusing matter for students. It is an accepted fact that visualization is an important component of the understanding of mathematical concepts. Mathematics books use drawings in order to illustrate the concept being described and mathematics instructors use drawings extensively in the classroom. However,this is insufficient for most of the students as is seen in students' performance on tests where graphs are required. We use the power of "Mathematica" and its built-in graphics in order to produce animation that will help the student understand how the graph is being traced both in polar coordinates as well as in cartesian coordinates. How does animation help in the understanding of the graphs of functions? In the animation process, the student is able to pause the animation, speed it up or slow it down. The order in which points are traced is clearly shown. Exercises could be given where students can describe the trace of the function or to compare the graph of the function in polar coordinates with that in cartesian coordinates. In the work described below, the order of critical points on the graph are shown as the graph is being traced. Some problems studied in Calculus are of the type where students are asked to find the area between two functions given in polar coordinates. From previous experience, they find the intersection points of the two curves by solving the two equations simultaneously and thus figure out the bounds of the region required. The same process when applied in polar coordinates does not work and most students do not understand why. In the work below, the two graphs are animated at the same time, thus the students can experience how the graphs are being traced.
2 Polar coordinates
The topic of polar coordinates is a diffilcult topic for students since points have multiple representations. Mathematica or a similar CAS system can be used to illustrate how the graph is being traced and the relationship of the polar plot to the Cartesian plot of the function. We can start with a simple function given in polar coordinates, such as sin(q). We show the students how to use ParametricPlot, so that they can see clearly that they are plotting the trace of the points {r cos(q), r sin(q)}.
We define the function r= sin(q)
r [theta_ ] = Sin[theta]
Sin[theta]
With the ParametricPlot we have to give the x value and the y value
pplot = ParametricPlot [{r[theta] Cos [theta], r[theta] Sin[theta] },
{theta,0,2Pi}, AspectRatio ->1 ]
We make a list of values, so that we can show these points on the graph
ppoints = Table [ {r[theta] Cos[theta], r[theta] Sin[theta] }, {theta, 0, 2Pi, Pi/4}]
{{0,0},{1/2,1/2},{0,1},{-(1/2),1/2},{0,0},{1/2,1/2},{0,1},{-(1/2),1/2},{0,0}}
lplot = ListPlot [ppoints, PlotStyle -> {PointSize [0.025], Hue[1]}];
p1= Show [pplot, lplot]
|
We can ask the students to explain why we have only 4 points showing in the ListPlot, whereas we have 8 points in the table. We now try to show the students the relationship between the polar plot and the cartesian plot. In order to do that we plot the function y= sin(q) cplot = Plot [Sin [q],{q,0,2Pi}, Ticks->{xticks, Automatic}, AxesLabel->{“q“, “y“}] Let us plot the points, {x, sin(x)} with x being 0, p/2, p, 3 p/2, 2 p, and then we show the plot together with the points on the graph. cpoints = ListPlot [ Table [ {x, Sin[x] }, {x, 0, 2Pi, Pi/4 }], PlotStyle -> {PointSize [0.03], GrayLevel [0.5]} ] p2 = Show [cpoints, cplot] Show [GraphicsArray [{p1, p2}] ] |
|
|
Fig. 1 |
|
|
|
|
Fig. 2 |
Fig. 3 |
As an exercise, the students can indicate the points which correspond to each other in the polar plot and the cartesian plot. We now see how a multiplicative factor of 2 will affect the plot, and we use the Mathematica function ParametricPlot to plot its graph
r [t_ ] = Sin[2t]
p = ParametricPlot [ {r[t] Cos[t], r[t] Sin[t]}, {t, 0, 2Pi},
PlotRange -> {-1.1, 1.1},
Ticks->{{0,Pi/4,Pi/2,3Pi/4,Pi,5Pi/4,3Pi/2,7Pi/4,2Pi}, {-1,0,1}},
AspectRatio ->1]
|
Let us plot the plot of r as a function of t c = Plot [r[t], {t, 0, 2Pi}] Like we did before let us make a table of points to see how the graph is being traced, and we will plot the graph with the points marked on it. ppoints = Table[{r[t]Cos[t], r[t]Sin[t]}, {t,0,2Pi,Pi/4}] pplot = ListPlot[ppoints, PlotStyle->{PointSize[.025], GrayLevel[0.7]}] pp1 = Show [p, pplot] Now we define the list of points in cartesian coordinates, and show the cartesian plot with the points marked on the graph cpoints = Table [ {t, r[t] }, {t, 0, 2Pi, Pi/4} ] cplot = ListPlot [cpoints, PlotStyle -> {PointSize [ .025], GrayLevel [0.5] } ] |
|
|
Fig. 4 |
cp1 = Show [c, cplot]
We can display the two graphs side by side by using the GraphicsArray function
Show [GraphicsArray [ {pp1, cp1}] ]
Here we define text labels for the points so as to see clearly how the graph is being traced. The point {0,0} is being traced 5 times as t varies from 0 to 2p
ppoints2 = Table [ { r[t] Cos[t], r[t] Sin[t] }, {t, 0, 2Pi, Pi/8} ]
lplot = ListPlot [ppoints2, PlotStyle -> PointSize [ .02] ];
Now we can see the polar plot plus the points marked on the graph
g1 = Show [ p, lplot ]
c1 = Plot [ r[t], {t, 0, 2Pi},
Ticks -> { { 0, Pi/4, Pi/2, 3Pi/4, Pi, 5Pi/4, 3Pi/2, 7Pi/4, 2Pi }, {-1, 0, 1 } } ]
c2 = ListPlot [Table[{t, Sin [2t]}, {t, 0, 2Pi, Pi/8} ], PlotStyle -> PointSize [.03]]
g2 = Show [ c1, c2 ]
We can display the two graphs side by side as follows:
Show [ GraphicsArray [ { g1, g2 } ] ]
|
|
|
Fig. 5 |
We would like to add labels to the points so as to see clearly how the two graphs are being traced. The following statement adds the label i to the ith point
t =
Show [Graphics [{{PointSize[0.5], GrayLevel[0.75], Map[Point, ppoints]},
Table [Text[i, Part[ppoints2, i]], {i, Length [ppoints ]} ] } ], PlotRange->All ]
p2 = Show [p,t]
We do the same for the cartesian plot
cpoints = Table [ {t, Sin [2t] }, {t, 0, 2Pi, Pi/8 } ]
t2 =
Show [Graphics [{{PointSize[.05], GrayLevel[0.75], Map[Point, cpoints]},
Table [ Text[i, Part [cpoints, i] ], {i, Length [cpoints ]} ]} ], PlotRange->All]
c2 = Show [c, t2]
Show [ GraphicsArray [ {p2, c2} ] ]
|
|
|
Fig. 6 |
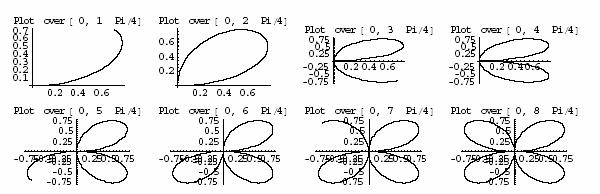
Another technique that can help students to understand the graph of a function in polar coordinates is to plot the function sequentially over different intervals and to place these in a graphics array. We first make a table of the plots adding labels to each graph
Clear [t]
r[t_ ] = Sin [2t]
y = Table [ ParametricPlot [{r[t] Cos[t], r[t] Sin[t]}, {t, 0, kPi/4}
DisplayFunction -> Identity,
PlotLabel->StringForm [“Plot over [0,`` Pi/4]”, k]], {k, 1, 8}]
We partition the 8 plots into groups of 2 and then display them with the Show function
Show [GraphicsArray [Partition [y, 4] ]]
|
|
|
Fig. 7 |
r[t_ ] = Sin [3t]
y = Table [ParametricPlot [r[t] Cos[t], r[t] Sin[t], {t, 0, k Pi/4}
DisplayFunction -> Identity,
PlotLabel->StringForm [“Plot over [0, ``Pi/4 ]”, k]], {k, 1, 8}]
Show [ GraphicsArray [Partition [y, 4] ] ]
We can also use PolarPlot, but we need first to load the graphics package
ClearAll [“Global `*” ]
<< Graphics`Graphics`
<< Graphics`Animation`
r[t_ ] = Sin [2t]
We now define the two functions points[k] and pplot[k] to show the graph of the function and the points marked on it only whe t varies between 0 and k Pi/8
points [k_ ] : = Module [ { ppoints },
ppoints = Table [{r[t] Cos[t], r[t] Sin[t]}, {t, 0, k Pi/8, Pi/8}];
Show [Graphics[{{PointSize[.05], GrayLevel[0.75], Map[Point, ppoints]},
Table [Text[i, Part [ppoints, i]], {i, Length [ppoints]}]}], PlotRange->All, DisplayFunction -> Identity ] ]
pplot[k_ ]:=PolarPlot[r[t], {t,0,k Pi/8}, DisplayFunction->Identity]
|
When k is 16, we get the graph of the function over the interval [0, 2 p] Show [points[16], pplot[16], DisplayFunction->$DisplayFunction] Now we do an animation of the graph as it is being generated Animate[Show[points[k],pplot[k],DisplayFunction->$DisplayFunction],{k,1,16}] |
|
|
Fig. 8 |
We can generalize this process to do an animation of any function in polar coordinates, selecting the number of points to be shown as well as the increment selected. So we will put all this information into a Module, passing the functions r to be plotted, the number of intervals and the increment Here the range over which the function is being plotted is from 0 to 2p, however we could include the range as parameters.
animatePolarPlot[r_,n_,d_ ]:=Module[{points,pplot,k},(*local variables*)
points [k_ ] :=
Module[{ppoints},ppoints=Table[{r[t]Cos[t],r[t]Sin[t]}, {t,0,kd,d}];
Show [Graphics[{{PointSize[.05], GrayLevel[0.75], Map[Point, ppoints]},
Table[Text[i,Part[ppoints,i]], {i,Length[ppoints]}]}],PlotRange->All,
DisplayFunction->Identity]];
pplot [k_ ] := PolarPlot[r[t], {t,0,kd}, DisplayFunction->Identity];
Animate[Show[points[k],pplot[k],DisplayFunction->$DisplayFunction], {k,1,n}]]
r[t_ ] := 2 (1–Cos[t])
animatePolarPlot [r, 8, Pi/4]
We can do several plots on the same graph, and show the animation of the two graphs as they are being generated. This can be used to show that when finding the points of interesection of two graphs given in polar coordinates, it is not enough to solve the two equations simultaneously as points have multiple representations and a point common to the two graphs may be given for different values of q.
Clear [r, r1, r2]
The following function is similar to the previous one, however it includes the graphs of the two functions r1, and r2
animatePolarPlot[r1_,r2_,n_,d_]:=Module[points1,pplot1,points2,pplot2,k},
points1 [k_ ] :=
Module[{ppoints},ppoints=Table[{r1[t]Cos[t],r1[t]Sin[t]},{t,0,kd,d}];
Show [ Graphics [ { {PointSize [ .05], GrayLevel [0.75], Map [ Point, ppoints ] },
Table[Text[i,Part[ppoints,i]], {i,Length[ppoints]}]}],PlotRange->All,
DisplayFunction->Identity]];
points2 [k_ ] :=
Module[{ppoints},ppoints=Table[{r2[t]Cos[t],r2[t]Sin[t]},{t,0,kd,d}];
Show [Graphics[{{PointSize[.05], GrayLevel[0.75], Map[Point, ppoints]},
Table[Text[i,Part[ppoints,i]], {i,Length[ppoints]}]}],PlotRange->All,
DisplayFunction - > Identity ] ];
pplot1[k_ ] := PolarPlot[r1[t], {t,0,kd}, DisplayFunction->Identity,
PlotStyle -> RGBColor[1, 0, 0] ];
pplot2[k_ ] := PolarPlot[r2[t], {t,0,kd}, DisplayFunction->Identity,
PlotStyle -> RGBColor[0, 1, 0] ];
Animate[ Show[ points1[k], pplot1[k], points2[k], pplot2[k],
DisplayFunction->$DisplayFunction, Axes -> True ], {k, 1, n} ] ]
r[t_ ]:= Sin[2t]
r2[t_ ] := 1- Cos[t]
PolarPlot[{r[t],r2[t]},{t,0,2Pi},
PlotStyle->{RGBColor[1,0,0],RGBColor[0,1,0]}]
animatePolarPlot [r, r2, 8, Pi/4 ]
Let us apply this to the following functions:
r [t_ ] = Cos[t+Sin[t]]; r2[t_ ] = Sin[t+Cos[t]];
PolarPlot[{r[t],r2[t]},{t,0,4Pi},PlotStyle->{RGBColor[1,0,0],RGBColor[0,1,0]}]
animatePolarPlot [r, r2, 8, Pi/4]
3 Conclusion
The code that we have developed here can be exploited in order to introduce visualization in the learning of polar coordinates, and in understanding the relationship between polar and cartesian coordinates. This material will be tested with students in Calculus III and we will be able to evaluate to what extent this approach is successful. A possible expansion of this work is to develop packages that can be loaded with the implementation details hidden so that the student can concentrate on the visualization and the interpretation of the visual information.
References
Galindo, Enrique (1995) Visualization and Students’ Performance in Technology-Based Calculus. Pres. at the 17th meet. of the PME-NA, Columbus, OH.
Stuart, James ( ) Calculus, fourth Edition. Brooks/Cole Publishing Company, Pacific Grove, Ca.
Wickam-Jones, Tom ( ) Mathematica Graphics, TELOS. Springer-Verlag Publishers, Santa Clara, Ca.
Wolfram, Stephen ( ) Mathematica, A System for Doing Mathematics, 2nd Ed.. Reading, Addison W.
Adding a sparkle to classroom teaching —
Using Word, the Internet, and object-oriented software
Douglas Butler
Peterborough, UK
Word documents can contain
5. items pasted from other applications
6. items pasted off a web page
7. embedded spreadsheets, using ![]()
8. The use of dynamic images in mathematics teaching
Word can be the common denominator for electronically stored lesson plans and teaching resources for mathematics. The purpose of this paper is to summarise how it is possible to squeeze a lot of mathematics (notation and diagrams) from Word using built-in features that are little know by many teachers. First we set up some extra tools on the toolbar:
|
|
|
Fig. 1 |

1 Word documents can contain equations as text
Using the UNICODE font system (NOTE – a MAC or a PC system prior to W-98 will not display the Unicode fonts). Use Insert => Symbol => Font => Normal Text. You can set up short-cut keys as required so that the current font can use its own symbols. The suggested ALT and some Ctrl keys:
|
ALT |
2 |
3 |
4 |
H |
R |
I |
O |
0 |
< |
> |
+ |
/ |
↑ |
↓ |
|
Symbol |
² |
³ |
¼ |
½ |
√ |
ò |
° |
¥ |
£ |
³ |
± |
÷ |
↑ |
↓ |
|
ALT |
A |
B |
D |
E |
F |
L |
M |
N |
P |
S |
T |
X |
← |
→ |
|
Symbol |
α |
β |
D |
Σ |
φ |
l |
μ |
n |
π |
σ |
θ |
χ |
← |
→ |
Ctrl
keys: Ctrl-E: € Ctrl-L: ℓ ; also: ⅓ ⅔ ¾ ⅛ ⅜ ⅝
⅞, γ ε ζ η ι κ ξ ρ ς ω,
Γ Π Φ Ω, ≡ ≠ ≈ ∩ ¶
The
proper MINUS sign ("–" or "en-dash") is available on Ctrl –
using the keypad '–'
Create
equations and formulae as text if possible. These expressions can then be
pasted anywhere, e.g. to an email or in a spreadsheet.
|
Examples: |
y = x√(1 – x²) |
y = π ± sin–1(½ x) |
σ² = (1/n) Σ (fx²) – μ² |
|
|
y = esin²x |
∫ sin²θ dθ = ∫½(1 – cos2θ)dθ = ½θ – ¼ sin2θ + c |
|
|
|
χ² ~ N(μ, σ²) |
∫ sin²θ cosθ dθ = ⅓ sin³θ + c |
|
2 Word documents can contain equations as graphics
Using the Equation Editor. These can be edited only using the Equation editor, equations created this way are graphics and require format and layout control, short-cuts can be placed in the “Auto-correct” list when selected in ‘move with text’ mode.
e.g. type “qf <ENTER>” for the quadratic formula:
Other equation editor examples:
|
Vectors and Matrices: |
|
|
Integrals: |
|
|
|
Summations: |
|


3 Word documents can contain object based diagrams
Using the drawing toolbar
|
|
|
Fig. 2 |

Points to note: the use of SHIFT and CTRL is crucial when creating these objects (Shift: makes the object regular, Ctrl make it centred). Also ensure that “Snap to Grid” is ON, so that objects fit together neatly (use “ALT” to over-ride this).
4 Word documents can contain
hyperlinks, using 
linking to
bookmarks in the same document, e.g. back to the start
linking to
files on the hard drive (e.g. an Excel file)
linking to
web pages (URLs), e.g. http://www.argonet.co.uk/oundlesch
some useful
web links from the Oundle site with dynamic images for the classroom:
|
|
|
|
![Textfeld: Mathematical resources
UK PLUS - Maths magazine - NRICH - Online Maths Club
Maths Year 2000
Australia Maths300 (Lessons on the Web)
Japan Mathematical JAVA applets
Sweden TIPTOP Virtual Laboratory - JAVA applets
Mathematical entertainment
Ron Knott's Fibonacci pages
Integer Lists to full accuracy
History of Mathematics (St Andrews)
Statistical resources
Data sets [further data resources are on the Autograph site]
DASL: USA Data and Story Library
The UK Lottery
Data from UN, by country
Statistical web resources from Sidney Tyrrell, Coventry University, UK](CD_Strand_2-Dateien/image057.gif)
5 Word documents can contain items pasted from other applications
|
e.g. a graph or text from Autograph – best place in a text box for greater control:
|
|
|||
|
Fig. 3 |
||||
6 Word documents can contain items pasted off a web page
text (which
can include their own hyperlinks)
graphics
(images pasted straight off a web page)
data (best
taken via Excel to sort out any problems)
7
Word documents can contain embedded spreadsheets,
using 
This way the spreadsheet remains ‘live’ and can be activated by double-clicking
8 The use of dynamic images in mathematics teaching
Example will include: The Circle Theorems illustrated (dynamically) in Geometer’s Sketchpad
|
|
|
|
|
|
Fig. 4 |
|
Demonstrating the Chain Rule using linked objects in Autograph
|
|
|
|
|
|
Fig. 5 |
|
Design of content independent instructional systems
Peter Cooper, Becky Magan, and Kelly M. Dilks
1. Background and theoretical perspective
3. Issues and general comments
As part of a development project conducted by the researchers on behalf of the U.S. Corps of Engineers Research Laboratory (Cooper and Smith 2001), the researchers developed land management training materials for two hydrology models EDYS (Childress e.a. 1999) and CASC2D. The specifications for the product included the use of Macromedia’s AuthorwareÔ as the delivery system. Typical Authorware products manage resources through proprietary libraries, making modifications to a product difficult for those not familiar with or who do not have access to Authorware. In order to reduce the time cost of revising materials for use in an Authorware-based product, the researchers decided to use Microsoft AccessÔ to store the content and provide a front-end for managing the data.
Of course separating the data from the delivery mechanism requires that a) the delivery system can access, parse, and display the data appropriately, b) that the structure of the display frames be such that a wide variety of content can be displayed in a coherent manner and c) that the display of content is a function of the contents of a record rather than the structure of the record. This explores the processes and techniques used in the development of the instructional system together with a demonstration of the (partially completed) product.
1 Background and theoretical perspective
In 2001/2, as part of a collaboration between Sam Houston State University and the United States Corps of Engineers Research Laboratories, training was developed for two potential components of the Land Management System (LMS) under construction by the Corps of Engineers in support of environmental management on Depart of Defense property.
In order to meet Department of Defense guidelines, and in order to maintain compatibility with previous training products developed through the university decisions were made to use Macromedia’s AuthorwareÔ as a front-end design tool. Authorware provides a framework for navigation through sequences of frames each of which may deliver a variety of multimedia components in a flexible environment. Authorware also provides for assessment and progress reporting. A further characteristic is that the resulting ‘compiled’ library can then easily be distributed to the target clients without the client having to be concerned with Authorware itself or the original source data files. During the design and construction phase the designers must develop and store all the source material, text, images, video sound etc. and then construct each display by placing components in within a framework containing navigation tools. Once complete, the files are then ‘compiled’ into a library file that is accessed through Authorware’s run-time module. From the user’s perspective the file structure of a compiled Authorware module is simple. There is no concern about missing files or components; installation is easy. While this process is simple and in many situations appropriate, there are occasions where the close coupling of interface and content does not work well. Where software changes significantly over time, where multiple software versions exist at the same time, or where the same delivery system is to be used for multiple training modules, it may be advantageous to separate the delivery system from the training content. This is the approach taken for this development project.
Theoretical perspective
Merrill (-) discerns three major components to the instructional process, organizational strategies, delivery strategies and management strategies. Organizational strategies are further divided into two; micro strategies involved with the characteristics of the display and macro strategies concerned with the selection and sequencing of content. Delivery strategies concern the techniques used to present the content to the student. Management strategies are concerned with mechanisms for aiding and supporting the student and include motivational techniques, scheduling, resource allocation and assessment.
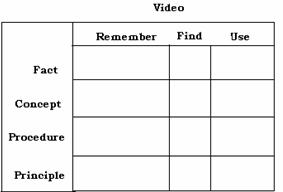
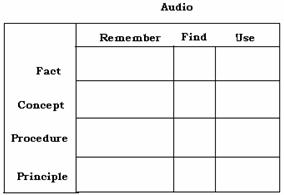
In general, Merrill suggests that content can be mapped to a performance-content matrix which informs the selection and sequencing of content and provides an appropriate framework for the development of test items. The performance levels are: remember, use, and find. The content levels are: fact, concept, procedure, and principal. By applying content to the performance-content matrix the training designer can establish, for example, that necessary facts are in place before concepts are explored and that the student can remember the necessary facts before be required to use those facts in solving a problem. This approach, Component Display Theory, provides a design tool that can be applied to content regardless of the media in which the content is stored or displayed.
Delivery system
The resources available to the target client are the single most important issue in designing the delivery system. Many users either do not have, or are unwilling to use Internet resources for training purposes. The project team decided that it was reasonable to assume a graphical user interface and at least a CD ROM but not necessarily high-end equipment or high-bandwidth communication facilities. In designing the delivery system the project team made the following assumptions:
Installation of the training system should be
effected through a simple GUI control such as an installation wizard, where the
client either does not need to make decisions about the placement of data, or
is provided suitable default settings.
The client has a simple intuitive interface for
navigation though the training system that provides a) a natural sequence and
b) facilities to interrupt or bypass that sequence if the client desires.
The training system should provide content and
assessment in manageable chunks and maintain information on the progress of the
client through the training.
The client should be made aware of key
terminology and be provided supporting documentation for that terminology.
The client should be able to pause the training
sequence in order to more fully explore key concepts.
The client should be able to easily return to
information previously encountered in order to review that information.
In addition, the project team was concerned that, as far as possible, in order to make the most general use of the delivery system, that the user interface be designed to be applicable to any content.
2 The components
Interface
The GUI was designed with a two level navigation system. Most large-scale training system can be divided into natural units. A series of tabs was devised to allow the training designer to define and label the units. Interface considerations limited the number of tables to a maximum of 10. Each unit could be accessed through its tab and the content associated with that unit was stored in a database table associated with that unit. Within each unit, the client would want to navigate from one frame to the next. Controls for sequencing backwards and forward through the content were provided. In addition the project team determined that the client may want to bypass the sequencing controls and so provided addition facilities for:
Moving to the beginning of a section
Moving to the end of a section
Moving directly to a previously marked page
Returning from a marked page to resume the
natural sequence
|
To provide a richer experience, while each page would be part of a main sequence it might contain information related to other issues which the client might want to explore. To allow for this the interface had to allow navigation to other points in the sequence or to side strands outside of the main sequence. To implement this the interface provides for up to four ‘hyperlinks’ to be associated with each page. When one of the hyperlinks is chosen the current page is marked before navigating to the new page allowing the client to return to the main strand at a later point. |
|
|
Fig. 1 |
Authorware provides a glossary tool. Again the interface was designed to allow up to four keywords within each page and to connect to the glossary through those keywords. An exampale page illustrating the interface is shown in Fig. 1.
Content layout
The project team identified a number of different styles of frame that might be useful in delivering training, including:
Frames containing text
Frames containing both text and graphics
Frames containing video and text
Each of the basic formats have a number of variations, for example, the text/graphic combination allows for the graphic to be placed in one of four different locations. The project team is well aware that only a small subset of the possible combinations has been implemented in this version but anticipates that future development will target a more flexible design system. Each text, graphic or video component within the various formats is connected to the storage system and accesses the appropriate data when the record is displayed.
Content development
The basic principles of content development are structured through an extension of Reigeluth and Merrill’s remember/find/use by fact/concept/procedure/principle matrix. In order to utilize multimedia components the authors determined that to extend the two-dimensional matrix to include a third, media dimension would allow for appropriate use of mixed media to support learning. One of the test training modules developed through the course of the project was one for the “Mathematics of Music” in which the basic knowledge, principles and skills for developing simple tuned instruments was explored. The Mathematics of Music content covered the development of a variety of musical scales from mathematical principles and the identification, testing and evaluating of those scales through the construction of a panpipes.
Five specific media were identified as appropriate to this content; rich text, video, audio, animated, and still images. Fig. 2 illustrates part of the modified matrix.
|
|
|
|
Fig. 2 |
|
Within the matrix, instructional content can be associated with a content type, instructional activity and delivery medium. It is probably easier to provide concrete examples to illustrate the association process:
|
|
Fig. 3 |
To determine the correct pipe
lengths for a pentatonic scale with A4 as the fundamental of the scale. This
task is representative of the Principle/Use cell. Text, or a mix of text and
animated graphics could support this task.
Mathematically the frequency ratios between the notes are as follows:
A/E = 2/3, E/B = 2/3, C/G = 2/3, F/C = 2/3, G/D = 2/3, A4/A5 = 1/2.
On a piano, the distance from A5 to A4 is called an octave having a 2:1 ratio between the frequencies of the two notes. From C3 to G3 is called a fifth, having a 2:3 ratio between the frequencies.
To create a set of panpipes
consisting of C4, G4 and C5. This task lies in the Procedure/Use cell. A
combination of video, audio and text instructions might be used to implement
instruction for this task.
It is not necessary, nor actually desirable for there to be one entry for each cell in the matrix. However associating material within the matrix enables the content designers to ensure that all the appropriate content is covered. There is also not necessarily only a single type of content appropriate to instructional content development. To accommodate users with different learning style preferences it is advantageous to consider multiple approaches, either through utilizing audio, video and text within the same frame or by using multiple frames of content each with a different medium emphasis. It is left as an exercise for the reader to identify how other content might fit the matrix.
Storage system
In order that we might separate the delivery system from the content, the project team developed a database to store the content and a set of queries designed to extract the appropriate data from the database and display the data in the interface.
The database consisted of a content table for each unit in the training, a quiz table for each unit in the training and a glossary table. The content tables contained fields holding text, and path information for graphics, audio and video. The database did not contain the multimedia files themselves, simply references to their location. This allows the database to remain relatively small and therefore provide better response times.
Each content table was structured as a doubly linked list. The frames are normally viewed in sequence and during initial data entry there may be a relationship between the storage sequence in the database and the display sequence in the interface. However, to make data entry easier and to disassociate the delivery and storage systems it was decided that each record (frame) in the database would contain a reference to the previous and next records in the training sequence. The primary benefits of the doubly linked list are a) records can be inserted into the database in any order and editing the sequence does not require reordering the records, and b) the pointers to next and previous records allow the hyperlinked pages to form closed loops or detours from the main sequence without have to retrace steps or provide complex database table interactions.
The variety of content layouts is implemented simply by having multiple possible components overlaid within the content area and one field within the content table associated with that component. If a record contains data within that field then the component is displayed, otherwise it remains invisible. Judicious insertion of data into the database defines the different display formats.
Of course the data entry process is thus made more complex and requires the development of a data entry module to simplify the process for the training developer.
Data entry
To simplify the data entry process a Visual Basic/Access application was developed. The training developer is provided with a GUI interface that performs the following tasks:
Allows secure login to ensure that the developer
is the only one modifying the data
Options for creating a new training module or
editing an existing one
Selecting and labeling up to ten units within
the training module.
Adding, editing or deleting records from a
selected unit.
|
|
|
|
Fig. 4 |
Fig. 5 |
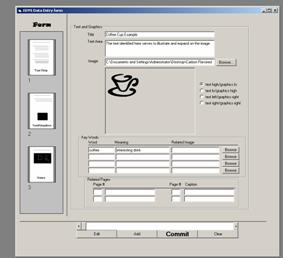
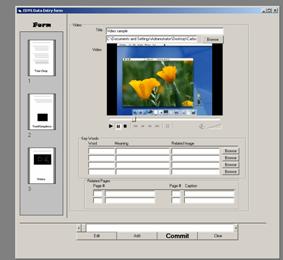
In its current form the developer can select from three different layouts, text, text/graphics, and video by simply click on the appropriate image in the left hand frame (Fig. 4). The data entry application manages the linked list data and the location and storage of media files transparently. The media files are displayed within the GUI to allow visual confirmation of the data. Figure 4 shows the layout manager for video frames. The video frames are playable within the application.
3 Issues and general comments
A number of issues have been raised by this project, most notably:
It is possible to disassociate
the delivery mechanism from the storage mechanism in the design of
training/instructional modules. Such a disassociation allows for a more dynamic
and generally useful system at some cost in terms of development complexity.
By separating the interface it
will in future be possible to use different GUI implementations with the same
data or data storage system, modify the data dynamically without having to
redistribute the delivery system, and change the connection mechanism between
the delivery system and data storage system transparently. This may simplify
both web-based and Intranet-based training systems.
Layout issues are still being
formulated. The current system implements some basic layouts. A more
sophisticated mechanism, perhaps a GUI-based placement tool chest, could
significantly add to the quality of the instructional experience.
The development of this system
reduces the training development issue to one of identifying and structuring
the content and the assessment tools (hardly a trivial issue still) without
having to be concerned with delivery or storage, and hopefully bringing the
instructional model to a more prominent position in the decision making
process.
References
Childress, M. et al. (1999) A Functional Description of the Ecological Dynamics Simulation (EDYS) Model, with Applications for Army and other Federal Land Managers. US Army CERL SMI Technical Report SMI-ES 009.
Cooper, P.A. and Smith G.W. A (2001) Development of a Hydrology Data Repository and Models Tutorial. Project funded through U.S. Corps of Engineers Research Laboratory and the Texas Research Institute for Environmental Science.
Merrill, D.M. (-) Component Display Theory. Reigeluth, C.M., (ed.) Instructional –Design Theories and Models, 282-332.
Geometria: A tool for the production
of interactive worksheets on the Web
Timo Ehmke
Flensburg, Germany
2. Interactive worksheets published on web-pages
3. Special functions of Geometria
With this contribution I will introduce the Java-Applet Geometria, a tool for interactive worksheets to be presented on web-pages. Worksheets generally contain a dynamic figure together with some kind of geometric learning content. This content is described by means of a script-language (GeoScript) which provides the possibility to construct an euclidean figure and also supports the analytical definition of points, vectors and curves. A special feature is the feedback given to the student, while he/she is interacting with the figure. A tutoring component enables Geometria to evaluating and commenting on the student's answer.
1 Introduction
In this article I would like to introduce the Java-Applet Geometria which I have programmed within the scope of my Ph.D. dissertation at Flensburg University (s. Ehmke 2001, 1997-2001). It is designed to develop interactive worksheets which can be published on web-pages in the internet.
Each worksheet contains a dragable figure to which a particular geometric learning content and complex problem is associated (s. Schuhmann 1997). The development of Geometria was based on the Geometry-Applet by David Joyce (1996). Large-scale application of Geometria was first demonstrated during the "ZERO – Mathematik online"-project at Flensburg University. This project presented web-based learning materials (lecture notes, exercises, supplements) for the education of mathematics teachers. For more details see the contribution of A. Schreiber in this volume.
2 Interactive worksheets published on web-pages
The nature of the interactive worksheet is demonstrated using the simple example of a parabola. Fig. 1 shows the graph of the function f(x) = ax2 + bx + c. The parameters a, b and c of this function can be varied through the corresponding scrollbars. Variation of any single parameter modifies the shape and position of the parabola accordingly. The student's task would be to determine the significance of any given parameter.
Each interactive worksheet consists essentially of three distinct components:
a
web-page with the Java-Applet Geometria,
a
GeoScript-file describing a
geometrical figure, and
a
GeoStyle-file determining the colour
and style of the figure and the drawing-plane.
The Java-Applet Geometria is inserted into a HTML-document using the APPLET-command. In above example this is accomplished as follows:
[...]
<applet code="Geometria" archive="geometria.jar" codebase="."width="480" height="360">
<param name="scriptPath" value="script/">
<param name="stylePath" value="style/">
<param name="script" value="parabel.script">
<param name="style" value="geometria.style">
<applet>
[...]
The GeoScript- and GeoStyle-files are named with help of the parameters script and style. Special path information is given by the Applet-parameters scriptPath and stylePath.
|
|
|
Fig. 1: The interactive worksheet shows a
parabola with the equation f(x) = ax2 + bx + c. |
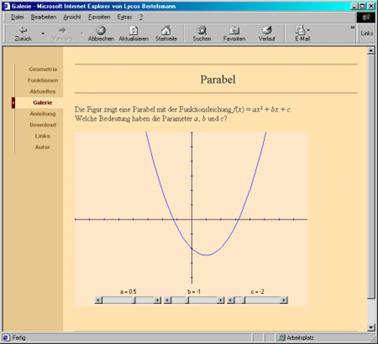
The geometrical figure drawn within an interactive worksheet is defined with GeoScript. A GeoScript-file is an ASCII-file, which contains the definition of a geometric figure in the script-language GeoScript. For each script a separate file is established. For example, the parabola in Fig. 1 is described in the file "parabel.script" as follows:
//
// Datei: parabel.script
//
// Figurenbeschreibung
// ===================
e[1] = O; point; fixed; 0.0,0.0; "hidden"
e[2] = OX; point; fixed; 1.0,0.0; "hidden"
e[3] = OY; point; fixed; 0.0,1.0; "hidden"
e[4] = K; point; coordSystem; O,O,OX,O,OY,300,300,200,200;
e[5] = a; measure; controller; 0.5,0.125,-2.0,2.0,120,"a = ","";
e[6] = b; measure; controller; -1.0,0.25,-3.0,3.0,120,"b = ","";
e[7] = c; measure; controller; -2.0,0.25,-3.0,3.0,120,"c = ","";
e[8] = p; line; curve; "t","calculate(a)*t^2+calculate(b)*t+calculate(c)",-6.0,6.0,50;
The description of a GeoScript-figure is similar to that used in traditional paper-and-pencil-geometry. Each line defines exactly one geometrical object. The structure of every line is uniform. Each geometrical object is numbered consecutive: e[1], ... , e[n]. The definition of the object is given following the 'equals' sign. At least four parameters have to be entered, each separated by a semicolon (s. construction-reference for Geometria in Ehmke 2001):
Object label: The object
label names the object on the drawing-plane.
Additionally, it serves as a reference when defining other objects.
Class name: The class
name defines the class of the object. Class names are limited to: point,
line,
circle,
sector,
polygon,
and
measure.
Subclass name: The
subclass name defines the exact subclass of the object. For example, the class point
contains, among others, subclasses which define fixed points, points of
intersection, or image-points of an transformation.
Object data: The object
data consists of several parameters, separated by commas. These serve to
construct and initialise an object. For example,
dragable point-objects require entry of a defining pair of coordinates to allow
display on the drawing-plane.
Layout data: Optionally,
an object can be provided with layout data, which overwrites the values of the GeoStyle-file. The GeoScript
command hideLabel,
prevents the object label from being displayed.
The command hidden hides an object in total.
It is also possible to use the dynamic geometry-system Euklid DynaGeo (from R. Mechling) to avoid describing a figure directly in the GeoScript format. A figure constructed with Euklid DynaGeo may be saved as a GeoScript-file. To be able to use the extended functions of Geometria (s. Section 3), which are not provided in Euklid DynaGeo, the corresponding commands may have to be added to the GeoScript-file.
Whereas the GeoScript-file describes the geometrical contents, the colour and style of an object are determined in the GeoStyle-file. A section of the GeoStyle-file “geometria.style” used in Fig. 1 is shown below:
//
// Datei: Geometria.style
//
// Systemvariablen
// ===============
APPLET_WIDTH = 480
APPLET_HEIGHT = 360
WORLD_X_MAX = +16.0
WORLD_X_MIN = -16.0
WORLD_Y_MAX = +12.0
WORLD_Y_MIN = -12.0
GRIDSIZE = 15
GRIDCOLOR = 235,205,180
BACKGROUNDCOLOR = 255,233,205
SHOWGRID = FALSE
SNAPTOGRID = FALSE
// Farb- und Formdarstellungen
// ===========================
<elementTable>
point; dragable; black; red; black; 0; smallCircle
point; horizontal; black; red; black; 0; smallCircle
point; vertical; black; red; black; 0; smallCircle
point; functionDepend;black; blue; black; 0; smallCircle
point; fixed; black; black; 0; 0; smallSquare
line; connect; black; 0; blue; 0;
line; straightline; black; 0; black; 0;
line; pointSet; 0; blue; blue; blue;
circle; radius; 0; 0; blue; 0;
polygon; polygon; 0; 0; black; 0;
</elementTable>
The first section of "geometria.style" assigns concrete values to the system variables. The second section consists of a table whose values determine the colours of the geometrical objects. The first two columns contain the class name and the subclass name of an object class. The columns three to six contains the values for caption colour, point colour, line colour, and surface colour. The seventh column is reserved for the form constants of point-objects.
3 Special functions of Geometria
Many dynamic geometry-systems restrict the possibilities of the user to develop interactive worksheets due to a limited availability of object types. To realise a wider perspective of geometry, Geometria offers a number of objects not included in other geometry-systems. Additionally, GeoScript contains multiple interfaces, designed to allow enlargement of the command range by user-defined classes and functions. Furthermore, Geometria includes a tutorial component which offers direct feedback to the student working with figures in the interactive worksheet.
The class of dragable figures
One of the aims at the conceptional state of Geometria was to realise an as extensive as possible class of interactive and dragable figures. In the following, I outline the constructable object types.
Euclidean constructions
and transformation geometry: With GeoScript euclidean constructions and
transformation geometry can be used to develop a geometric figure. Among others, the following object types are
available: straight line, line segment, ray, bisector of an angle,
perpendicular line, parallel line, circle, polygon, locus. Furthermore, a number of dragable and
non-dragable point-objects can be used.
Dragable point-objects may be moved either within the complete
drawing-plane or within a defined point-set only. Examples of non-dragable point-objects
include points of intersection, or image-points of a transformation.
Analytically defined
objects and term evaluation: Analytically defined
objects, such as function dependent points, parametric curves or vectors can be
generated directly by an analytical equation.
Variable parameters, used to define analytical objects, are controlled
by scrollbars (s. example in Fig. 2).
Furthermore, Geometria
contains an object designed to evaluate mathematical terms.
Point-sets: GeoScript allows the
author to display an arbitrary static point-set on the drawing-plane. A point-set is defined by the set of all
black-coloured points within a black-and-white-graphic. Each point-set-object may be used as a
reference object for dragable points (s. example in Fig. 3).
|
|
|
Fig. 2: Analytic defined objects, e. g. ellipses, tangents, or curves, can be generated directly by an analytical equation in GeoScript. Individual parameters can be varied by scrollbars. |

|
|
|
Fig. 3: On the given egg-shaped curve you can move a line-segment OS with fixed length. The point X lying on OS is moving on a non-convex path. According to the Holditch-Theorem: The area F between the egg-shaped curve and the non-convex curve is F = p x y with x = OX an y = XS. This means, F is independent from shape and position of the egg-shaped curve. The point-set (egg-shaped curve) is defined by a black-and-white-graphic. |
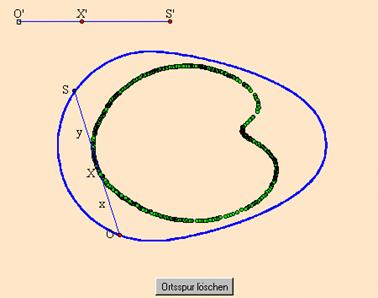
Interfaces
Geometria provides three software-interfaces to enlarge the command scale:
Java interface for
specific curve-objects: Appropriate Java classes can
be integrated through the interface in GeoScript
to calculate the course of a curve (s. example in Fig. 4).
Java interface for
user-defined functions: A second interface allows
integration of user-defined Java functions.
Arbitrary geometric objects may be used as parameters of such a
function. The return-value has to be a
real number.
JavaScript interface for
user-defined functions: With Geometria user-defined JavaScript functions can be integrated. The JavaScript function enables the use of
control elements within the web-page, such as scrollbars, checkboxes or
list-fields (s. example in Fig. 5).
External Java classes and JavaScript functions can be integrated through GeoScript without the necessity to further compile the source-code of Geometria. The structure of the external functions merely require execution of a few formal criteria (s. Ehmke 2001).
|
|
|
Fig. 4: In the figure a fractal tree is defined by five points. Line segment AE is given as trunk. The segments EB, EC and ED are the branches of the tree. With every iteration step each branch develops three new branches. The shape of the fractal tree is calculated in a external Java class. |
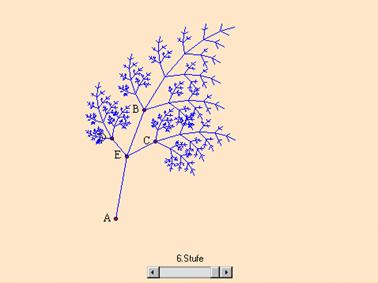
|
|
|
Fig. 5: Through the JavaScript-interface in GeoScript JavaScript-elements can be used to manipulate the geometric figure. In this example radio-buttons determine which graph is shown in the drawing-plane of Geometria. |
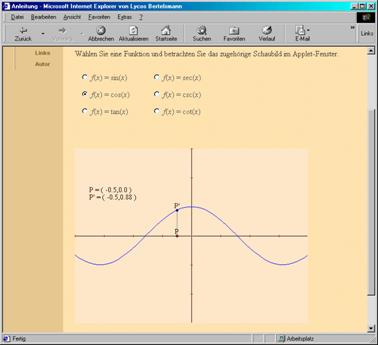
Response analysis
Each interactive worksheet can be equipped with a response analysis and so create a tutorial learning environment. The widely used method of response analysis in a Computer-Based Training frame as described by Schreiber (1998), has been applied in Geometria to the special case of dynamic geometry. In contrast to other dynamic geometry systems, Geometria does not judge or comment on the construction of a figure, but comments instead on the current state of the figure, i. e. the shape and position at a given moment. The author of a figure defines the response analysis within a GeoScript data file by describing an arbitrary number of figural states and associating a list of feedback commentaries with each state. This provides the possibility to judge and comment not only on right answers, but also on solutions which are partly right or even wrong. If an external class is used to check the geometric figure, an extensive and complex response analysis can be achieved.
In the example shown in Fig. 6 there are six squares which can be translated onto a grid in the drawing plane by dragging the centre of each square. The response analysis checks if the six squares are so placed that the web can be folded to form a cube. This is realised with the help of an external Java class, which is integrated through the Java interface in GeoScript. This external class uses the coordinates of the six centres as input parameters and delivers a numerical value r as a return value. In GeoScript each return value r is associated with an appropriate feedback commentary: r = 1 (“Right. The web can be folded to form a cube.”), r = -1 (“Wrong. The web is not connected. Just try again.”), or r < -1 (“Wrong. The web can not be folded to form a cube. Just try again.”). When the response analysis is started by pushing the evaluation button, the external Java class calculates the return value depending on the current figural state. On the basis of this value Geometria chooses the relevant commentary and shows the feedback to the student. A more detailed description of the underlying model of the response analysis is given in (Ehmke 2001).
|
|
|
Fig. 6: In this figure the response analysis checks if the student has placed the six squares so that web can folded to form a cube. The response analysis gives the student feedback within a separate window. |
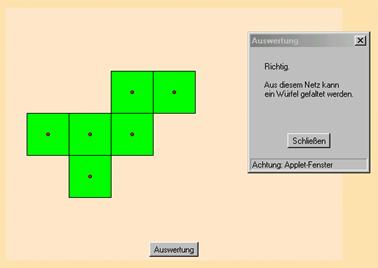
References
Ehmke, T. (2001) Eine Klasse beweglicher Figuren für interaktive Lernbausteine zur Geometrie. PhD Diss. University of Flensburg.
Ehmke, T.( 1997-2001) Geometria. Flensburg, Rotenburg, URL: http://www.geometria.de/
Joyce, D. (1996) Geometry-Applet. Clark University,
URL: http://aleph0.clarku.edu/~djoyce/java/Geometry/Geometry.html
Mechling, R. (1994-2001) Euklid DynaGeo, Version 2.3. Offenburg, URL: http://www.dynageo.de/
Schreiber, A. (1998) CBT-Anwendungen professionell entwickeln. Springer, Berlin, New York.
Schumann, H. (1997) Interaktive Arbeitsblätter für das Geometrielernen. Preprint. PH-Weingarten.
Creating and teaching online mathematics courses
Mary Susan Hall
Marietta, USA
3. Mathematics 1113 Precalculus Online
1 Online courses
As colleges and universities try to reach more and more students, they turn to creating online courses. It is through these courses that they can reach many students who would not, otherwise, be able to take college courses. However, the course must be equal to the regular class both in content and evaluation. In addition, online courses must have the support of the faculty and the administration. Finally, there is creation of the course.
Assuming support of the administration, then it would follow that ones' peers would also be supportive if the content and evaluation methods were in keeping with college standards. In my case, the content must be the same and the major tests and final exams are proctored. The tests may be given on different campuses or at a local high school or library. The main thing is that the test is given to the person taking the course. This requires a photo ID. In addition, the person giving the test must be a reliable proctor.
Setting up an online course is a time consuming task. There are several components of a typical online course. These are
1 information
2 communication and
3 testing
which has already been discussed.
Information includes syllabus, information forms, student releases, and class notes and study sheets. It also includes projects, handouts and book assignments. Think about all the information that is given in the classroom that has to be conveyed in writing.
The current information page has links to the course outline, the teaching guide, academic honesty policy, syllabus, assignments, testing and retesting policy, withdrawal policy, and a daily plan work schedule.
The daily plan work schedule lists two days a week with the book assignments, links to online notes that are relevant, and links to reviews and take home tests. This was created so that the student could go to one source for all of the information.
A sample entry is:
1 Read the sections 2.1-2.4 Functions, Domain, Range and Transformations
2 Take home test 1 assigned
3 Try sample exercises to see if you understand the material.
4
Read the online notes that are associated with the
sections.
Natural Domain, Functions, Composite Functions, Rational Functions.
5 Do selected problems from the text:
2.1 Problems 1-53 odd
2.2 Problems 3, 7-23 odd, 25, 29-37 odd, 41, 43, 55-58, 61-67, 69, 71, 75, 77, 79-82
2.3 Problems 1-25 eoo, 20, 26
2.4 Problems 1-25 odd, 33-49 odd
6 Do the problems on the test review. Answers are posted at the end.
7 Post to the WEB CT Bulletin Board or forum or to chat from two times a week.
Communication includes telephone, email, fax, instant messages, and bulletin board and chat rooms. In order to be consistent, our college is currently using Web CT for chat, and bulletin board. . Students are encouraged to interact together through the bulletin board and chat. They may talk to one another by phone or may choose to get together for study sessions with students who live close to them. Of course, there are designated sign-in times for the bulletin board and chat periods. During those times, the instructor is available specifically for them.
Quizzes and take home tests are posted online or are faxed to the student who then faxes them back complete with all work. Tests are given in proctored situations.
I have three courses online currently: Math 0099(Pre-college Algebra), Math 1111(College Algebra), and Math 1113(Precalculus).
Math 0099 is a learning assistance course as well as a developmental studies course. In this case, learning assistance refers to students who may drop out of their collegiate math course during the first 3-5 weeks of the semester and enter the Math 0099 course.
The course is a developmental studies course because students, who pass the exit course material in math 0098 but who fail to pass the exit test (CPE or College Preparatory Exam), may take Math 0099 to continue learning new material in preparation for the collegiate level. These students must pass the course material in Math 0099 and the final. If they do, they are required to pass the CPE to exit developmental studies (learning support).
In addition to a review of prior learning support courses, Math 0099 includes additional topics including functions, parabolas, circles, and rational inequalities. I have incorporated TI-83 projects as well to better prepare my students for the collegiate math-modeling course. This course began in 1997.
The second course, college algebra, began this year. It includes study of linear functions and their graphs through exponential, and logarithmic functions. The TI-83 is used extensively in this course.
The third course, Precalculus, began in the fall of 1999 and continues through the present. The course covers "the study of functions and graphs (algebraic, exponential, logarithmic, trigonometric, and parametric functions), inverse functions, applications of functions, matrices and systems of equations, and vectors.
The courses have a similar drop rate to the regular college courses. The drop rate over all for the math courses is about 38%. The drop rate for the online math courses is between 40 and 50%. The average grade in all math courses is 78. The average grade in each of the online courses is 82. These averages do not include withdrawals in either type of course. The higher average in the online course may be due to the type of student that remains in the course. Many students who might be doing poorly in the traditional course remain in the class while these same students will drop the online course. It takes a special type of student to take an online course. The major thing is their personal discipline and self- motivation. Students who lack initiative will not do well in such a course. As students learn their limitations and become more familiar with online courses, the drop rate should be about the same.
Once the courses were set up, one might think that the majority of the work was completed. This is just not true. When students have questions on assigned problems, I create a web page with the solution. I write email responses and discussion responses. I talk on the telephone to students and so on. I have created the table below to give a modest representation of time. In addition to that, I teach regular classes as well. Time spent on the weekend is generally from 3 to 6 hours.
|
Every day |
Math 0099 |
Math 1111 |
Math 1113 |
|
Check email |
20 min |
1 hour |
1 hour |
|
Create web page |
20 min |
1 hour |
1 hour |
|
Write to discussion |
20 min |
1 hour |
1 hour |
|
Grade papers |
10 min |
30 min |
30 min |
|
Miscellaneous |
5 min |
30 min |
30 min |
|
Total hours |
1:15 |
4:00 |
4:00 |
|
Total per week (5 day) |
6:15+ hours |
20+ hours |
20+ hours |
Even so, with all the effort that it takes to offer an online course, it is worth it. Many students who normally would not be able to take classes are able to take online courses. The students who do stay in the class do generally very well. One gets to know their students very well in an online course. I encourage anyone interested to pursue the creation of one.
2 A helpful list of URLS
Student
Handbook for Online Courses
http://www.gpc.peachnet.edu/~pgore/distanceed/studenthandbook.php
Standards
and Guidelines for Online Courses
http://www.gpc.peachnet.edu/~pgore/distanceed/standards.html
Online
Courses
http://www.gpc.peachnet.edu/~mhall/online/online.htm
Math
0099 Course Page- Web pages
http://www.gpc.peachnet.edu/~mhall/online/math0099/math99sp.htm
Math
1111 Course Page- Web pages
http://www.gpc.peachnet.edu/~mhall/online/m1111/m1111sp.htm
Math
1113 Course Page- Web Pages
http://www.gpc.peachnet.edu/~mhall/online/m1113/m1113sp.htm
3 Mathematics 1113 Precalculus Online
|
|
|
|
Georgia Perimeter College |
|
|
Mathematics Department |
|
|
Math 1113 |
Precalculus Mathematics |
|
|
|
|
Welcome to Precalculus Mathematics online. This is the beginning of an adventure in mathematics. You of course want to know what is expected of you, and how you will learn. There is so much information to share that each type of information has links on separate pages. |
|
|
|
|
|
Table of Contents |
|
|
A. Information 1. Book assignment B. Notes, Reviews, Sample |
D. Web CT 1. Go
to Web CT 3. Helpdesk
for WEBCT F. General College Information 1. GPC
Home Page G. Required Text J. Testing |
|
|
|
Tuesday |
Thursday |
Information |
|
January 09
|
January 11 |
Instructor Mary S Hall |
|
January 16 |
January 18 |
Office Phone Office Hours Syllabus is subject to change. ATTENDANCE POLICY: Students should attend
every class meeting the full time. Arriving late or leaving early counts as
from one-half to one full absence, depending on how much time is missed. Mid term
March 13
12:00-2:00 Friday May 4 Exam |
|
January 23 |
January 25 |
|
|
January 30 |
February 1 |
|
|
February 6 |
February 8 |
|
|
February 13 |
February 15
|
|
|
February 20 |
February 22 |
|
|
February 27
|
March 1 |
|
|
March 6 |
March 8 |
|
|
March 13 |
March 15 |
|
|
March 20 |
March 22 |
|
|
March 27 |
March 29 |
|
|
April 3 |
April 5 |
|
|
April 10 |
April 12 |
|
|
April 17 |
April 19 |
|
|
April 24 |
April 26 |
|
|
|
|
Georgia Perimeter College |
|
|
Mathematics Department |
|
|
Math 1113 |
Precalculus Mathematics |
|
|
General
Information |
||
|
|
Course Outline
|
||
|
|
|||
|
|
Assignments |
||
|
|
Assignments |
||
|
|
Detailed Assignments Day by Day |
||
|
|
|||
|
|
|
|
|
|
|
|
|
|
|
|
Syllabus |
||
|
|
Syllabus |
||
|
|
Syllabus Policies |
||
|
|
|||
|
|
|
||
|
|
. |
||
|
|
|
|
|

|
Class Reviews |
|
Welcome to Precalculus Mathematics online. This is the beginning of an adventure in mathematics. You of course want to know what is expected of you, and how you will learn. There is so much information to share that each type of information has links on separate pages. |
|
|
Online Review Materials |
||||||
|
|
Online review materials take several forms. First there are the class notes. The class notes are similar to the notes that you might take on a particular topic in class. Then there are the test and quiz reviews. The test and quiz reviews are replicas of the actual quiz or test that you will have to take. You could call them practice tests and quizzes. Treat them that way and study them. They have the problems and the solutions to those problems. In addition, The take home tests that are online are 10 problems taken from the review but with the numbers changed. Use the test and review quizzes to help you do the take home tests. |
||||||
|
|
|
|
|||||
|
|
Class Notes |
||||||
|
|
|||||||
|
|
|||||||
|
|
|||||||
|
|
|||||||
|
|||||||
|
|
|
||||||
|
|
Test and Quiz Reviews |
||||||
|
|
|||||||
|
|
|
|
|
|
|||
|
|
Comprehensive and Detailed Assignments Step by Step |
||||||
|
|
|
|
|||||
|
|
|
|
|
|
|||
|
|
Take Home Test |
||||||
|
|
The take
home test must be turned in when you come to take the test. |
||||||
|
|
|||||||
|
|
|
|
|
|
|
||
|
|
Book Problems |
||||||
|
|
|
||||||
|
|
|
|
|
|
|
||
Methods for Learning
General Methods
Each class time in the syllabus has sections to be covered. These are the sections that would be covered in a traditional classroom. In is traditional classroom, we would answer questions from the previous assignment and then discuss the new sections. Students would do practice exercises to test for understanding and finally the assignment of homework would be given.
Your online course will be visual mainly. That means that you will need to read a lot of material. Typically, you will follow the following methods:
1. Read the sections that are assigned for that day.
2. Try sample exercises as you read to see if you understand the material.
3. Read the online class notes that are associated with the sections.
4. Do selected exercises from the assignment sheet.
5. Do appropriate exercises from the next sample quiz or test.
6. Post to the WEB CT Bulletin Board or forum or to chat from two times a week.
January 09
1. Read the sections
1.8
Fundamentals
2. Try sample exercises as you read to see if you understand the material.
3. Read the online class notes that are
associated with the sections.
Chapter 1
4. Do selected exercises from the assignment
sheet.
Chapter 1:
Fundamentals 1.8 Problems 63-85
odd
5. Do appropriate exercises from the next sample
quiz or test.
Test
1 Please note that the solutions are at the end.
Please note also that the quiz you will take will be the same as the one online
with the numbers changed of course.
6. Post to the WEB CT Bulletin Board or forum or to chat from two times a week.
January 11
1. Read the sections
2.1-2.4
Functions,domain range, trans
TakeHome1
Assigned
2. Try sample exercises as you read to see if you understand the material.
3. Read the online class notes that are associated with the sections.
4. Do selected exercises from the assignment
sheet.
2.1 Problems 1-53 odd
2.2 Problems 3, 7-23 odd, 25, 29-37 odd, 41, 43, 55-58, 61, 67,
69, 71, 75, 77, 79-82
2.3 Problems 1-25 eoo, 20,26
2.4 Problems 1-25 odd, 33-49 odd
5. Do appropriate exercises from the next sample
test.
Test
1 Please note that the
solutions are at the end. Please note also that the quiz you
will take will be the same as the one online with the numbers changed of
course.
6. Post to the WEB CT Bulletin Board or forum or to chat from two times a week.
January 16
7. Read the sections
2.5-2.7 max,min,composite,inverses
8. Try sample exercises as you read to see if you understand the material.
9. Read the online class notes that are associated with the sections.
10. Do selected exercises from the assignment
sheet.
2.5 Problems 1-41 eoo, 42, 43, 47-51 odd, 57, 59, 62
2.6 Problems 1, 5, 7, 9, 15-25 odd, 29, 31, 33 [(g o f ) only],
37 [(f o g)only],41-47 odd, 51, 55, 57 [or 15-55 odd]
2.7 Problems 1-15 odd, 19, 21, 27, 29, 33, 37, 43, 50, 51, 53(In 23-40,also
state the domain of the function and of its inverse.)
11. Do appropriate exercises from the next sample
test.
Test 1 Please note that the solutions are at
the end. Please note also that the quiz you will take will be
the same as the one online with the numbers changed of course.
12. Post to the WEB CT Bulletin Board or forum or to chat from two times a week.
Teaching probability and statistics via the Internet
Judith H. Hector
Morristown, Tennessee, USA
2. Mathematics instruction online
3. The nature of the Internet course
4. What are the characteristics of a successful online student?
5. Factors for a successful online probability and statistics class
1 Introduction
The author developed and taught a probability and statistics class online for the first time in fall, 1999 at an American community college in the state of Tennessee. She has since repeated the class three more times and intends to continue to improve and teach the course. All programs of study at her college require a mathematics course as part of the general education requirements to graduate with a two-year college degree. The probability and statistics course meets this requirement for many different programs of study such as nursing, psychology, criminal justice, and primary school teaching. The rationale for developing an online method of delivery for probability and statistics is that there are students seeking further education at a distance. These students are unable to commute to campus on a regular schedule. Their reasons vary and include work schedules, health, family obligations and lack of transportation. Therefore, the need existed to offer this mathematics class in a format that freed such students from the constraints of meeting at a specific time and place. The class covers the same content and requires the same standard of performance as a face-to-face class.
2 Mathematics instruction online
Getting started
Once it became apparent that teaching mathematics online was possible and was needed, the author began to gather information on developing online instructional materials. There are many rich sources of information including workshops, online courses, and online, both printed and online. Several online resources are listed at the end of this paper. It is also very helpful to consult with instructors who are already teaching on line.
Some instructors begin small by first developing a class Web page and then adding study aids linked to the class page. “According to Kenneth Green’s Campus Computing Survey, in fall 200l about 40 percent of courses at public universities [in the USA] had class Web sites (Johnstone, 2001). It is common to find a syllabus, an assignment list, a calendar, explanations of how to use a graphing calculator, study notes, and practice tests at class Web sites. Some instructors have developed online study aids to support both face-to-face classes and Internet classes. An example set of study aids is “Visual Calculus”, a rich site containing tutorials on key topics from the Calculus. The site is available at the Math Archives, a National Science Foundation supported site. (http://archives.math.utk.edu/visual.calculus/ )
Often the most visited pages of a class Web site are practice quizzes. The quizzes can be set up to provide immediate feedback. Students are motivated to spend time taking practice tests and then restudying the questions they have answered incorrectly. It is a great advantage for students to have access 24 hours a day from home to practice quizzes. Also the institution is freed from having to provide printed copies, a place to house and distribute the quizzes, and personnel to staff a location.
There are a variety of options for an instructor who wants to develop his or her own online quizzes. For examples of several types of online mathematical quiz questions, go to a presentation on delivering web-based quizzes, click on “What the student sees", then click on each example under "Sample Questions."
(http://www.cs.appstate.edu/~jlh/snp/ICTCM0/ICTCM0.html )
J. L. Hirst developed the examples at the preceding site in a purchased class management system called WebCT. It is also possible to use free software to develop tests online. One such site is at http://www.funbrain.com/ . Another site is at
http://builder.cnet.com/webbuilding/pages/Programming/Kahn/070198/toolqc.html
Putting mathematics online
An instructor wishing to communicate either static or dynamic mathematical formulas must search out ways that go beyond the regular text features of word processors. Formulas created in Microsoft Word with its built in Equation Editor appear on a Web page in the gif file format. A piece of software called MathType has a more complete set of features to handle most mathematical and scientific formulas. (http://www.mathtype.com) Symbolic statements produced in MathType also appear as static gif images on the Web. Incorporating dynamic mathematical symbols and animation in Web pages involves more software and more effort. A suggested reading on this subject is “Math on the Web: A Status Report” at http://www.dessci.com/webmath/ . There is still work to be done in developing and standardizing the means of placing mathematics on the Web.
Dr. Larry Husch and Dr. Earl Fife have placed a short course about putting mathematics on the Internet in the Math Archives at http://archives.math.utk.edu/WPT/barrett/. The biggest consideration in using special software to create interactive mathematical formulas and animations is that students must download additional software called plug ins in order to view these Web pages at home. In some cases, students are hindered by older versions of browsers, limited memory, and slow modem speeds. The author of Web pages must determine whether students will be able to access more sophisticated Web pages. This issue does not arise if students will access the pages on campus through a designated computer lab set up with the appropriate plug ins.
Interactive mathematical formulas and animations enhance student learning. In a study of the use of animation and color in Web study pages in support of a plant pathology class, Partridge and Osborne (1999) noted that students often downloaded the animations and printed them in black and white. Therefore, students were not taking the time to view the animations as a learning exercise. An instructor must balance the amount of time it takes to develop dynamic Web pages with how much time and effort students are willing to commit to using the pages in the way the instructor intends for them to be used.
Online classes and online degrees
Higher education in the United States is embracing the Internet as a means of instructional delivery. The demand for Internet classes is growing rapidly. For example, the U. S. Army recently announced a 600 million dollar Army University Access Online plan (“Army bares,” 2000). The Army expects 1 million soldiers, Army employees and family members to enroll in online classes in the next five years. The two public higher education systems in the state of Tennessee have begun to offer two-year and four-year degrees for a small number of programs of study as of Fall, 2001. Student may choose to do all classes online or may choose to mix face-to-face classes with online classes. The author's college participates in the Tennessee Board of Regents online degree program (http://www.tn.regentsdegrees.org/).
3 The nature of the Internet course
The nature of the college and the students
Walters State Community College offers the first two years of university coursework for students who intend to enter a variety of occupations such as engineering, medicine, teaching, psychology, business, and industry. The college is 30 years old and is located in a rural area of the southeastern part of the United States in the state of Tennessee. The college awards associate degrees and also certificates for technical training in such fields as respiratory care, culinary arts, and law enforcement.
All 6,000 full and part-time students commute to class because there are no campus residences. Most students are the first ones in their families to attend higher education. The average age of the students is 27. Some students enter the college immediately after secondary school. Some begin college 10 or 20 years after secondary school. Many students are parents (and grandparents) and work at full-time jobs.
The class described in this paper is an introductory probability and statistics course designed to meet university requirements in a variety of majors such as psychology, sociology, primary school teaching, nursing, or criminal justice. Local industry also encourages technicians to enroll to increase their skills in statistical process control. Each semester, the mathematics department teaches about 10 classes of probability and statistics in classrooms. The Internet section taught by the author uses the same syllabus, covers the same content, and uses similar testing procedures as the classroom based sections.
Key features of the course
The class is listed as an Internet course in the timetable of regular classes along with the URL (uniform resource locator) of the Web site for the class (http://vc.wscc.cc.tn.us/math1080/). Students may enroll by telephone and pay fees at that time by entering a credit card number. There is an optional Sunday afternoon orientation session on campus lasting about 2 hours. At the orientation, students receive a syllabus, assigned problems for the first chapter in the text, and hands on instructions on how to use a TI-83 calculator to do statistics. Students are informed that the course is guided self-study with a textbook (Triola, 2001) as the primary source of instruction. Students may also check out videotapes prepared by the textbook author for additional instruction. The instructor collects e-mail addresses from all students and asks them to send her a message by e-mail during the first week of the semester. During orientation, students also visit the class WebBoard to do a practice posting of autobiographical information and participate in a chat room associated with the course. Students learning at a distance receive orientation by e-mail. As the 15-week semester continues from August into December or January into May, students experience the following:
weekly
assigned probability and statistics readings and exercises,
online
quizzes after each chapter with immediate feedback,
a
deadline by which an online quiz is to be submitted to the instructor,
feedback
on quizzes e-mailed to individuals by the instructor,
scheduled
on campus assessment by examination at middle and end of the course,
proctored
exams for distance students with proctors approved by the instructor,
posting
of information to the WebBoard by the instructor when beeded,
frequent
e-mail contact between instructor and student initiated by each,
the
opportunity to send e-mail to the instructor at any time for help or questions,
an
optional weekly chat session with the instructor,
optional
chat and e-mail among students, and
optional
telephone or face to face contact with the instructor.
A little over half of the students who enroll complete the class for credit. Most students choose Internet class delivery because job or family responsibilities make class attendance difficult or impossible. For example, several pregnant students have scheduled Internet classes for the semester in which their babies were to be born. Most use personal computers at home, although some access e-mail from their jobs. Some have taken Internet classes previously, usually in English composition or literature, and feel comfortable with the format. The reasons for failure or withdrawal from the class have included a death in the family, personal or family illness, increased workload on the job, or other factors limiting time available to study.
Students express positive evaluations of the course at the end of the semester. Students respond anonymously to an online survey. The college’s Webmaster summarizes responses for a class and also for all classes taught online that semester. For example, approximately 90% of the probability and statistics students state that they would like to take another Internet class. About 67% respond that they learned a great deal from the course. From 67-75% feel that the pace of the class was just right. From 67-75% of the students respond affirmatively that the frequency and quality of interaction with the instructor was adequate. The range is from 67% to 83% in the affirmative on whether the frequency and quality of interaction with other students was adequate.
4 What are the characteristics of a successful online student?
The probability and statistics class Web site contains a hyperlink to resources designed to help a student decide whether an online class is appropriate for him or her.
http://illinois.online.uillinois.edu/IONresources/onlineoverview/StudentProfile.html
These resources indicate that successful online students are usually self-motivated and self-disciplined. It helps if students commit to study from 4 to 15 hours per week for the class. Students are expected to read and write well. Students should have the necessary knowledge prerequisite to the class they undertake online. They should be good time managers. Students should ask for help when they need it. They should have access to appropriate computer hardware and software. The student characteristics listed at this site and others are extensive.
Any student possessing all the characteristics of a successful online student would be welcomed and even recruited to attend a classroom-based course! Most students choose classes delivered via the Internet because this delivery method allows a student to learn without scheduled class times and according to a student's personal schedule. A student who selects an online class to meet personal scheduling needs may not possess all the characteristics listed as important to success in an online course. Therefore, an instructor should build into the structure of his/her online course features that help students compensate for what they lack.
5 Factors for a successful online probability and statistics class
Communicate the special demands of the course early
Communicate the nature of the online course and expectations for students early in the course. The author orients each student in a face-to-face meeting or by e-mail to these tips for success. Each student is expected to:
a. Send an e-mail message before the end of the first week of class.
b. Pace study by the dates on the study guides.
c. Distribute study over several days per week.
d. Read the book critically with a pencil and calculator at hand and work out the examples.
e. Do the assigned exercises from the textbook with a TI-83 calculator.
f. View the videotapes if they are helpful.
g. Read the instructor's e-mails thoroughly.
h. Take the online quizzes seriously and submit the scores on time.
i. Use the feedback from the quizzes.
j. Contact the instructor with questions.
k. Prepare a sheet of notes for proctored tests.
l. Review exercises and quizzes before tests.
m. Contact the instructor before a missed deadline or test.
Use e-mail efficiently and effectively
a. Develop the class e-mail list during the first week and contact as soon as possible students who are enrolled, but have not submitted an e-mail address.
b. Get student permission and then share the e-mail list with the class to encourage contact among students.
c. Ask that all student use short, specific subject lines including a key word.
d. Filter all class e-mail using the key word to a separate mailbox.
e. Respond to e-mail regularly and let students know when there will be a delay in responding.
f. Use e-mail for routine class management including notices that have been posted on the WebBoard.
g. Provide specific e-mail tips for the harder sections of each chapter in the textbook.
h. Send notes of encouragement or direction regularly to each member of the class.
i. Encourage students to e-mail the instructor about anything that is unclear. Share the questions and instructor comments with the whole class when appropriate.
j. Be aware that shy students may be more open and communicate more readily by e-mail than face-to-face. Encourage this communication.
k. Consider writing out formulas as sequences of calculator key strokes because communicating mathematical symbols by e-mail presents some difficulties.
Develop instructional Web pages that enhance the class
a. Pace students through the class using calendars, schedules, study guides, and other instructional Web pages.
b. Develop Web pages with simulations, animations, and step-by-step explanations. It is important to note that students do not like to read lengthy passages of text on a computer screen. They have a tendency to print Web pages in black and white in order to read a paper copy. This "print and go" process removes hyperlinks, animation, color and other efforts by the instructor to enhance text.
c. Some students may experience visual frustration when words or graphics move or are animated.
d. Be aware that interactive mathematics on Web pages often requires that a student have appropriate "plug in" software, an up-to-date version of a browser, a fast modem, and specific computer capacity. Some students who would benefit from the interactivity of a Web page may be unable to access the page.
Make use of the immediate feedback capabilities of technology with online quizzes
a. Students are motivated to practice with online quizzes that indicate correct and incorrect answers because the feedback is immediate.
b. Students can judge what they know and still need to learn from online quiz feedback and find the feedback more helpful than printed answer keys.
c. Online quizzes with grade book or e-mail reporting features lighten the scoring and grade recording work for instructors.
d. The probability and statistic class described here makes use of online quizzes and reporting features of the Web site for the text book at http://www.awlonline.com/triola .
6 Conclusion
Many young people in the United States are growing up with Internet use as a consistent part of their experience. They expect to use the Internet as part of their learning. "According to a National Public Radio report in March of this year, 75 percent of kids between the ages of 12 and 18 in the United States went online in January 2001 (Johnstone, p. 24). This generation will have expectations that some of their instruction in higher education will be delivered on the Internet. The challenge for mathematics instructors is how to best develop and deliver this instruction.
References
Johnstone, S. (2001) Virtual worlds: Generating a whole new set of challenges. Syllabus, 14(10), 20.
Johnstone, S. (2001) “What should be capturing faculty attention". Syllabus, 14(12), 24.
N.N (2000) Army bares $600 million program to educate soldiers. The Knoxville News-Sentinel (July 11), 1, 9.
Partridge, J. E. and Osborne, L. (1999) Designing and using World Wide Web study pages to support student learning outside of the classroom. NACTA Journal, 43, 43-46. (National Association of Colleges and Teachers of Agriculture)
Triola, M.F. (2001) Elementary Statistics, 8th ed. Addison-Wesley, New York.
Additional resources on web teaching
Best practices: Implementing the seven principles: Technology as lever. 1997). [Online]. Available: http://www.tecweb.org/eddevel/de95.html
Boettcher, J., & Cartwright, G. P. (1998, July 7) Designing and supporting courses on the web. [Online]. Available: http://contract.kent.edu/change/articles/sepoct97.html.
Connick, G. P. (Ed.). (1999). The Distance Learner’s Guide. Upper Saddle , NJ: Prentice Hall. (Companion Web site: http://www.prenhall.com/dlguide)
Schweizer, H. (1999). Designing and teaching an on-line course: Spinning your Web classroom. Boston, MA: Allyn and Bacon.
Derco and Little. “Teaching and Learning with Technology: Developing a Teaching Enhancement Plan.” http://www.it.utk.edu/itc/courses/ls151/techniques.html
Knight, J. “Step by Step Guide to Using Instructional Technology in Teaching”, London Guildhall University. http://itc.utk.edu/~jklittle/it/steps.html
“Quality On-the-Line: Benchmarks for Success in Internet-based Education,” 2000. Institute for Higher Education. http://www.ihep.com/quality.pdf
A web-site for a mathematics support centre
D. A. Lawson, J. Reed, and S. Tyrrell
Coventry, UK
2. The Mathematics Support Centre
3. Basic content for the web-site
The Mathematics Support Centre at Coventry University offers support to any student in the University who wants help with any area of mathematics, statistics or quantitative methods. The support offered by the Centre is in addition to that routinely received in lectures, tutorials, seminars, problems classes, etc. The primary mechanism of support is one-to-one contact offered to students on a 'drop-in' basis. This support is staff intensive and in order to optimise the use of staff time alternative methods of supporting students are continually under review. A recent development has been the introduction of a web-site for the Centre. This paper describes the background to the Mathematics Support Centre, the development to-date of the web-site and an evaluation of its use.
1 Introduction
Mathematics as a subject underpins, to varying extents, a wide range of disciplines including engineering, natural sciences, business studies, economics and health sciences. Students enter programmes in these subjects with a wide variety of mathematical skills (Sutherland and Pozzi 1995). In some of these programmes there are compulsory units in mathematics, statistics or quantitative methods. In others, students are assumed to have the required competencies on entry to university or the methods are covered, often briefly, within another unit.
The problems of inhomogeneity of intake and of changes in incoming competencies of students (Hunt and Lawson 1996) are not easily solved. A variety of approaches have been tried. One which is finding increasing favour is the establishment of a 'Mathematics Support Centre' (Croft and Lawson 2000, Croft 1998, 2000, Lawson and Reed 2001). Such centres provide support to students which is in addition to that routinely offered through lectures, tutorials and other scheduled classes.
In this paper we give the background to the provision of a Mathematics Support Centre at Coventry University and describe the support it offers. The facilities of the Centre are continually under review, with a view to increasing the effectiveness of the support provided. This has led to the development of a web-site for the Centre. In subsequent sections of this paper we outline the material which is made available through the web-site. This includes simple information such as the location and opening hours of the Centre and a range of handouts which students can download. Students who have deficiencies in their mathematical backgrounds need to be able to practice their skills and receive feedback when they make mistakes. This is achieved through the use of on-line assessment. We also describe some early attempts to use short, simple multi-media presentations to illustrate some key principles in a more user-friendly way than static text on a page. Finally we report on the use of the Centre's web-site to date and outline ways in which we hope to increase this in future years.
2 The Mathematics Support Centre
In 1991 Coventry University received a grant from the Engineering Education Fund of British Petroleum (BP) to establish the BP Mathematics Centre. The original aim of the Centre was to support engineering students who, because of their increasingly wide variety of educational backgrounds (Sutherland and Pozzi 1995), were experiencing difficulty with the mathematics that they were required to study as part of their course. There were two clearly identified strands to this support: early identification of problems and on-going help throughout their course of study.
Diagnostic testing is used to carry out the early identification of problems. The diagnostic test is delivered during induction week and each student receives a personal diagnosis of his or her strengths and weaknesses. Where weaknesses are identified the students are directed to visit the Mathematics Centre to receive assistance.
On-going help is provided through the one-to-one support the Centre offers students on a drop-in basis. In the first instance this support addresses weaknesses in the students backgrounds identified by the diagnostic test. Students are helped to address these weaknesses by reference to a wide ranging set of resources, primarily short paper handouts and a growing amount of on-line material. They are supported in their use of these resources by one-to-one tuition.
From these beginnings the work of the Centre has expanded and changed its name to the Mathematics Support Centre. It now supports students on all courses in the university (not just engineering). Diagnostic testing, which was originally carried out only on courses where students were thought most at risk (about 200 students per year), is now widespread with three different levels of test being used (around 800 students per year).
Surveys of students show that the one-to-one contact with a tutor is valued very highly. However, staff time is an expensive and limited resource. It is therefore important that other ways of supporting students are fully utilised so that staff time can be channeled to where it is most needed. For this reason the introduction of a web-site for the Centre was seen as highly desirable.
3 Basic content for the web-site
Many students visit the Centre during induction week and are given a leaflet about the Centre. However, for a variety of reasons, some students do not visit and of those that do some lose the leaflet. So the need remains to provide basic information such as the opening times of the Centre, where it is located and what support it provides. Fig. 1 shows the Centre's home page. The basic information referred to here is found by clicking the buttons 'Opening Hours' and 'About the Centre'.
|
|
|
|
|
|
Fig. 1: Mathematics Support Centre home page |
|
The Centre provides a wide range of short handouts on basic topics in number, algebra, trigonometry, graphs, calculus and statistics. Stocks of these handouts are available free of charge in the Centre. However, they can only be collected whilst the Centre is open. Making copies available on the web-site gives students access to these handouts at any time, not just during Centre opening hours.
Particularly at the start of the academic year there are a number of questions, often in basic algebra, that are asked by many students. The frequently asked questions (FAQ) page is a useful place for recording both these questions and their answers. This serves an additional purpose beside that of communicating the answers to the specific questions. It shows students the sorts of questions that their colleagues are asking and reassures them that they are not the only one struggling with relatively simple mathematical topics.
4 Assessment
The amount of formative assessment which is available in many modules has declined enormously in recent years as the numbers of students on courses has risen. Staff no longer have the time to mark large numbers of questions and return them with detailed feedback. On-line assessment is particularly useful to give students an opportunity to carry out self-assessment and receive feedback on their answers. There are many proprietary packages available for carrying out on-line assessment over the web. However, as the on-line tests the Centre makes available are designed to give the students an opportunity for feedback and for self-assessment, the sophistication of these packages is not needed. A simple on-line form can be used as shown in Fig. 2.
|
|
|
|
|
|
Fig. 2: Start of algebra on-line test |
|
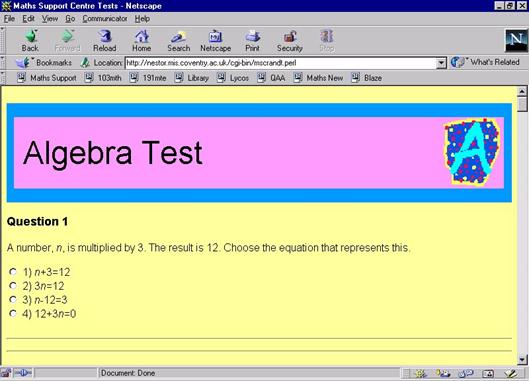
Tests are available at two levels. There are overview tests which contain questions from across the breadth of a topic area (such as algebra). In addition there are much more focused tests dealing with a specific item (such as factorising quadratics) from a broad topic area. Where students answer questions wrongly they are referred to a specific handout (which is available from the Handouts page) which should help them to identify their error or misunderstanding.
5 Extra features
As has already been noted, students particularly value individual attention. The finite opening hours make it difficult for some students (notably part-time students with work commitments) to visit the Centre. In an attempt to offer them some personal support the web-site features a 'Send us your problems' section. This enables students to email their questions to Centre staff who aim to reply within 24 hours of the question being sent. An example of a problem sent by email is shown in Fig. 3. Since this problem was sent in the email address has been changed to one dedicated to the Centre.
|
|
|
|
|
|
Fig. 3: Problem sent by email |
|
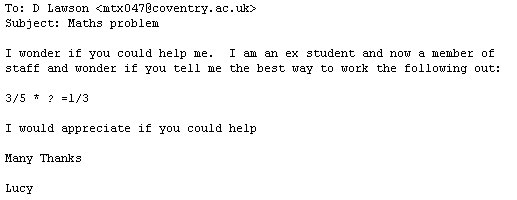
Presentation of material on-line provides opportunities that are not available with paper handouts. For example, animations can be used to step through solutions to problems or to demonstrate how various procedures are carried out. In addition sound can be added to these animations to explain precisely what is being done. The user can be given control of the speed of presentation by using 'Next' and 'Back' buttons. An example of this, which explains the process of multiplying out brackets is illustrated in Fig.s 4 and 5.
Each time the user clicks the 'next' button the next step of the process is illustrated on screen and a short audio commentary explaining what is being done is given. If the user wishes to see a particular step again they can press the 'back' button to see and hear the last step repeated.
|
|
|
|
|
|
Fig. 4: Part way through animation on multiplying out brackets |
|
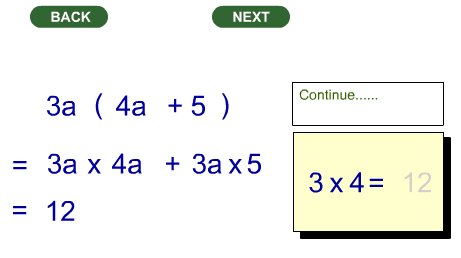
|
|
|
|
|
|
Fig. 5: Animation after next step of the process |
|
6 Evaluation of use
The Centre web-site was launched in September 2000, just prior to induction week which took place in the last week of September. In the week before induction week considerable effort was devoted to raising awareness of the existence of the web-site amongst staff in the university. Fig. 6 shows the number of hits on the site during the first 9 months of its availability. As would be expected the number of hits dropped after the initial highs in September and October when new students visited the site. The low December figure is caused partly by the fact that term finished on December 15th and although the web-site remains available during the vacation student motivation to visit it is not as great. So, in reality the figure for December is for little more than half a month. Likewise the figure for January represents about three-quarters of a month. Since January there has been a steady increase in the number of hits on the web-site. Three-quarters of April was taken up by the Easter vacation, but there was no drop in the number of visits that month. The imminence of end of year examinations probably provided students with the motivation to continue to use the site. The number of visits to the site is now over 100 per week, more than the number of personal visits to the Centre.
|
|
|
|
|
|
Fig. 6: Number of hits on Centre web-site since its launch |
|
The pattern of visits to the basic information is somewhat surprising. The proportion of visitors to the 'opening hours' page each month has been within the range 15-20%. A similar pattern is evident for the 'how to find us page' with all but one monthly figure in the range 13-19%, with some evidence of a small drop over the last three months. It is possible that students might forget the opening hours and so need to check them again. However, once students have visited the Centre in person they are unlikely to need to check the location again. This suggests that a significant proportion of hits on the web-site each month come from new users.
In terms of the mathematical material available at the web-site the on-line tests are the most heavily used facility. Fig. 7 shows a comparison between the number of hits on worksheets and tests over each of the first nine months. The usage of the test is spread fairly evenly amongst the 64 currently available, with the exception of the first one in a topic section which is visited the most. It is encouraging to see this usage of the on-line tests. If students want handouts they can collect them from the Centre, but testing is something which is available only on-line. The very high numbers of tests taken during April and May indicate that the students see them as useful revision aids. Comparing the number of tests taken with the number of hits on the site shows that many students will take more than one test per visit.
|
|
|
|
|
|
Fig. 7: Hits on worksheets and tests |
|
7 Conclusions
The web-site described in this paper is still under development and will remain so for the foreseeable future. The evidence, in terms of the usage of the web-site, suggests that this is a facility that students value. The on-line support that is provided through the web-site is not meant to replace the one-to-one personal contact which students receive when they visit the Centre. However, it does provide a way of giving students access to some resources when the Centre is closed and also for those students who find it difficult to visit the Centre. In addition, the on-line testing provides an opportunity for self-assessment and feedback which is not otherwise be available.
References
Croft, A.C. (1998) Enhancing the Mathematical Education of Engineering Students through a Mathematics Learning Support Centre. Demlova, M., Mustoe, L., Olsson-Lehtonen, B. (eds) Proc. 9th SEFI Europ. Sem. Mathematics in Engineering Education. Arcada, Helsinki, 39-43.
Croft, A.C. (2000) A guide to the establishment of a successful mathematics learning support center. Int. J. Math. Educ. Sci. Technol. 31, 431–446.
Croft, A.C. and Lawson, D.A. (2000) Degree courses + mathematics = happy students Sunday Times, 5th March.
Hunt, D.N. and Lawson, D.A. (1996) Trends in the Mathematical Competency of A Level Students on Entry to University. Teach. Math. and Its Appl. 15, No 4, 167-173.
Lawson, D.A. and Reed, J. (2001) University Mathematics Support Centres: Help for Struggling Students. To appear in Proceedings of Applications of Maths in Engineering & Economic, Sozopol, Bulgaria.
Sutherland, R. and Pozzi, S. (1995) The Changing Mathematical Background of Undergraduate Engineers. Engineering Council, London.
The collection of interactive solid figures
and spatial situations in the Cabri - geometry
Pavel Leischner and Karel Kabelka
České Budějovice, Moravské Budějovice, Czech Republic
3. Vertical, oblique and central projections
4. Development of the boundaries of polyhedra into planar nets
1 Introduction
The software package, Cabri-geometry II, is an interactive geometry notebook. It allows you to construct geometric objects on a virtual drawing sheet which has an area of about 1 m2. One can, of course, modify the visible part of the drawing and display it in the window of another section of the drawing sheet.
Cabri-geometry allows one to construct the main types of elementary geometric objects as points, line segments, lines, triangles, polygons, circles and conics. This set of primitive objects can be enlarged due to the "macro-construction" function, which enables one to define a new construction by simply designating its initial and final elements on a prototype produced on the screen.
Cabri-geometry has many features. It is easy to construct the images of created geometric objects that have undergone various basic transformations (for example, axial and central symetries, reflections, translations and inversions) and to see exactly how a figure was elaborated by reconstructing it step-by-step. One of the greatest advantages is the possibility of making these geometrical objects dynamic.
The planar nature of Cabri-geometry makes it possible to generate stereometrical figures of descriptive geometry, but the creation of interactive figures of solids is more difficult. Drawing, for example, an image of a polyhedron in an oblique projection, and wanting it to rotate about an axis, one has to ensure that the relevant changes are made to both the form of the faces and the visibility of the edges. In practice it is more convenient for a teacher to open a file with a pre-prepared basic solid figure, rather than to create the solid figure himself (herself). These figures can then simply be changed, completed and manipulated as required.
The purpose of this paper is to acquaint the reader with a collection of such files containing a range of interactive solid figures and spatial situations. The files were developed by Karel Kabelka, a student of the Pedagogical Faculty University of South Bohemia, in his diploma thesis "Applying of Cabri-geometry in high school stereometry". The entire collection and the manuscript of Kabelka’s thesis are accessible (only in Czech) from the internet address
http://www.pf.jcu.cz/katedry/m/zajimav/cabri/cabri.html
2 Solid figures
The collection contains three types of our files for use with Cabri-geometry. The first group of files consists of solid figures, to which one can apply additional constructions. For example, it is possible to change their form and measurements and to rotate them about the vertical axis by means of control-diagrams, which are located on the left hand side of each figure. It is also possible to change the shape of the base of some of solid figures, for example pyramids and prisms. All controls work in the same way: you grasp the point which is marked on the line of the control by pressing the mouse button and then drag the point.
|
|
|
|
|
|
Fig. 1 |
|
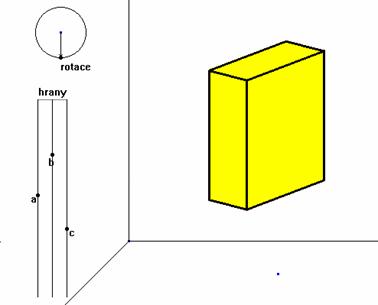
The solid figures are drawn in two different forms. When first presented to the youngest pupils it is better to work with those of the first type (Fig. 1). Later, when we want pupils to imagine even the back part of the solid, we use the second form, in which the invisible edges are marked by a dashed line (Fig. 2). The pictures are particulary useful when studdents are faced with problems of drawing polyhedra. When working on a task, we can either complete the task with the figure as presented, or, if the orientation of the figure is not suitable for the task, we can turn the solid into an optimal position. Taking measurements of diagonals and angles is clearer if we use colour to highlight the triangles with which we are working. When making a decision about the mutual position of lines in a figure, pupils can add the required lines into the interactive polyhedron. By rotating the object, pupils can better image the situation in space. Later, pupils should be able to perform such manipulations mentally. We can use the same method to convince a pupil that he or she is wrong to consider the illusive point of intersection of skew lines to be a real point.
|
|
|
|
|
|
Fig. 2 |
|
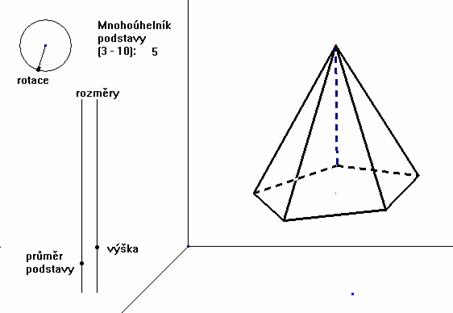
|
|
|
|
|
|
Fig. 3 |
|
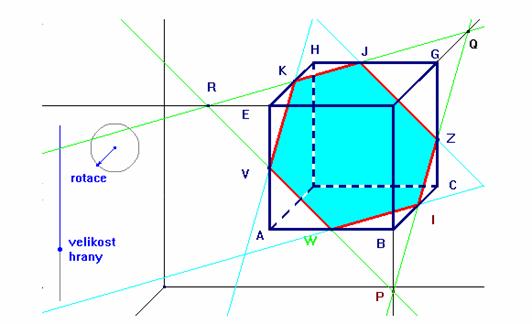
Interactive objects can also be used to construct sections of solids (Fig. 3). The advantage of using these objects is that it is possible to turn the solid body to more appropriate viewing positions. This enables pupils to solve the task on their own, or allows the teacher to demonstrate the more difficult aspects of the solution. The generation of a cylinder by rotating a rectangle (Fig. 4) can be demonstrated to the class as a whole.
The generation of an one-sheed hyperboloid (Fig. 6) is possible to show by rotating a stright line fixed on a cube (Fig. 5).
|
|
|
|
|
|
Fig. 4 |
|
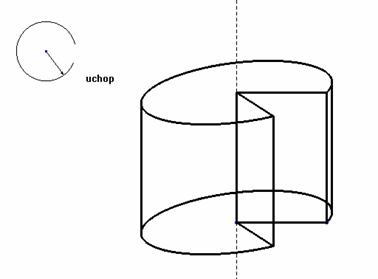
|
|
|
|
|
|
Fig. 5 |
|
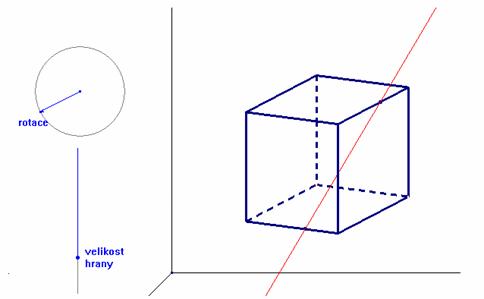
|
|
|
|
|
|
Fig. 6 |
|
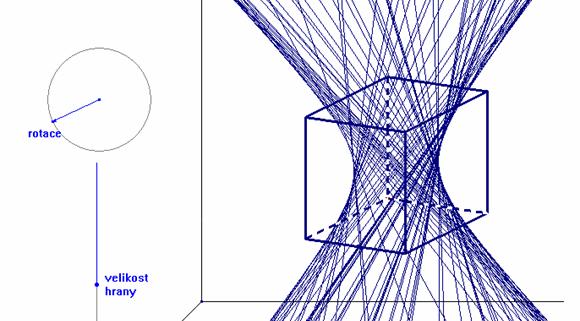
3 Vertical, oblique and central projections
The second group of teaching files are used to illustrate vertical, oblique and central projections. We can study the features of a particular projection by applying the projection to a cube. Parameters of each projection are variable. In this way we can compare oblique projections which differ by the angle between the x-y axes and by the ratio of units on those axes. Later we can experimentally verify whether a given projection preserves parallelism, verticalism or length.
We recommend to show the illustration of central projections (Fig. 7) because of their similarity to our visual perception of the world. Pupils who use only parallel projection in maths lessons would certainly be interested in it because of an attractive link between mathematics and art. (The teacher should emphasize these facts as well with the presentation of single adjustable parameters of projection. )
|
|
|
|
|
|
Fig. 7 |
|
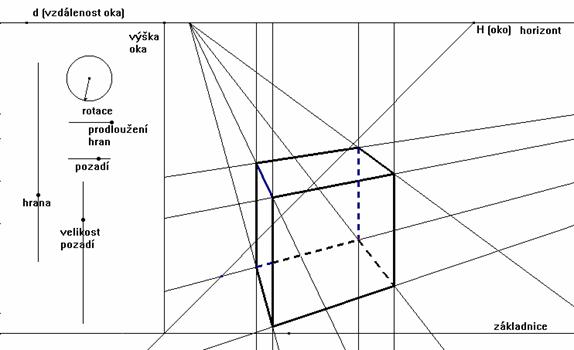
4 Development of the boundaries of polyhedra into planar nets
Our third group of files can be used to show the development of the boundaries of polyhedra into planar nets. The creation of nets of polyhedra is a useful task for helping students develop spatial imagery. Each of our pictures presents the boundary of a polyhedron. Colourful edges are cut lengthwise. The pupils have to imagine the movement (revolving round edges which are not cut), whose result is a net of the given polyhedron.
Faces of a polyhedron can be opened by using the control-diagram (Fig. 8) or by selecting one of the vertices of the face and dragging it (Fig. 9). We can even change the sequence in which we open the faces. Later pupils can imagine this happening and then check their hypothesis by using Cabri. Ultimately, they are asked to solve such problems on their own without using a computer. This group of figures will be used to study the influence of various teaching methods on the developtment of spatial imagery skills.
|
|
|
|
|
|
Fig. 8 |
|
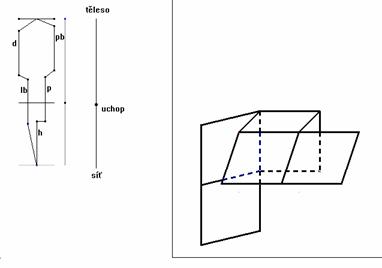
|
|
|
|
|
|
Fig. 9 |
|
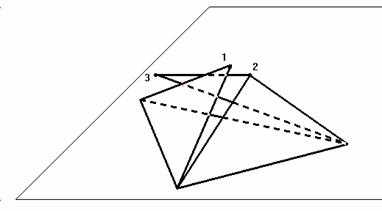
5 Concluding remarks
Interactive computer solid pictures join the possibility to manipulate with solid models and the abstraction of a geometric projection. The main purpose of these Cabri files is to help students, through experimentation, develop the visualisation skills necessary to carry out complex geometric manipulations and abstract projections mentally.
Computer assisted assessment of proof = Proof of CAA
New approaches to computer assisted assessment for higher level learning
Michael McCabe, Ann Heal and Alison White
Portsmouth, UK
4. Objective questions for Mathematics CAA
1 Introduction
We have used computer assisted assessment (CAA) successfully in support of maths teaching for 10 years, most commonly for first year university course units, where subject material is basic. This leads to the widespread belief that CAA is only appropriate for low-level learning. Nevertheless another reason why CAA is often used in first year course units is that student numbers tend to be greater, making the time spent on developing CAA more worthwhile. The assumption that CAA is inappropriate for all higher level learning is starting to be challenged (King, 2001, Beevers, 2001).
Mathematical proof is a topic which students find difficult to grasp and involves a higher level of learning. We teach computer science undergraduates about the different methods of proof, as part of a second level maths for computing unit. The need for rigorous and precise arguments is important in, e.g. demonstrating the equivalence of two different computer codes, deriving results from graph theory applicable to computer networks, showing the equivalence of a recursive and non-recursive formula and proving the correctness of a recursive algorithm. The unit also lays the foundations for more advanced work on algorithms and formal methods.
We have used the Mathematics for Computing 2 unit as a test-bed for exploring the extent to which different forms of CAA can support the delivery of higher level learning. Initially our focus is on standard CAA, delivered interactively to each student by computer.
We follow this up by considering the contribution that group response systems, used in interactive classrooms, have had to play in promoting learning. Such group, or audience response systems have been described as 3rd generation CAA (McCabe, Heal and White, 2001) because of the extra dimension which they add to the student-teacher interaction.
2 Learning outcomes
Higher level learning is commonly identified with the upper three levels of Bloom’s taxonomy of learning objectives. Bloom (1956) proposed 6 levels of cognitive learning, each associated with learning outcomes and a set of verbs.
|
|
|
|
|
|
Fig. 1: Bloom Cognitive Learning Levels |
|
The assessment of a learning outcome is achieved by a question or task based upon the corresponding verb. Each level depends upon achievement in the underlying levels. A variety of alternatives, modifications and extensions to the Bloom classification scheme have been proposed. For example, Anderson and Krathwohl (2000) suggest independent classification of knowledge levels and a reversal of the upper two Bloom learning levels.
|
|
|
|
|
|
Fig. 2: Anderson and Krathwohl Knowledge Levels |
|
This highlights the fact that the Bloom learning levels are neither sequential steps in problem solving nor measures of cognitive complexity. Furthermore their application in mathematics has often been reconsidered. For example, evaluation, the highest Bloom learning level, could be simply taken to mean checking that a numerical solution satisfies an equation or has a sensible value. Further lack of clarity arises from the mathematical uses of words such as evaluation (of a formula), analysis (of a function), solution (of an equation) and proof (of a theorem). Even the term applied mathematics is suggestive of “foundation thinking”.
3 Objective question design
Use of objective questions involving numeric, algebraic, text, multiple-choice and multiple response answers are commonly regarded as appropriate for foundation thinking, but incapable of assessing higher level learning. By adding advanced question types, from ordering and hotspot to drag and drop assembly and essay, it may be possible for higher levels of learning to be assessed. First of all, we consider how our questions have been designed from the commonly used techniques:
conversion of traditional questions
use of templates
use of verbs associated with learning outcomes
One of us, Alison White, is a department-based educational technologist who helps teaching staff to deliver both formative and summative CAA in mathematics and computer science. Since teaching staff often have limited experience of objective testing, a common approach is for them to provide traditional questions for conversion. When the objective CAA questions are returned for approval, some are regarded as unsatisfactory, because they do not achieve what was intended. Another approach is to offer templates for generating similar objective questions, but this can often be viewed as limiting by academic staff. Nevertheless we often use templates for designing summative test questions based upon formative test questions. This reduces authoring time and encourages students to practice on the formative tests. Learning outcomes are not usually specified explicitly.
Yet it is the failure to specify learning outcomes clearly in advance that can cause problems and lead to inappropriate questions. While learning outcomes are routinely specified for course units and for pieces of coursework, it is relatively unusual to see them on individual assessment questions. A critical test of CAA against equivalent means of assessment is whether it addresses the learning outcomes. If these are clearly stated for every question in advance, then it is much easier for staff to decide upon their suitability. If shown to students as well, they can identify more clearly what outcome is being assessed.
4 Objective questions for Mathematics CAA
In mathematics there are other issues to consider. Learning levels could be based on how the subject is expressed in a hierarchy from words – numbers – tables – graphs – diagrams – symbols. The symbolic representation of algebra is then viewed as the highest level.
A common problem in identifying whether a learning outcome is higher level or not in Bloom-based taxonomies stems from the ambiguity of verbs. Apart from the obvious double-meaning of evaluation, mathematical tasks, such as calculate, solve and prove, cannot be pigeon-holed easily. Calculation and solution could be classified under application or analysis. Mathematical proof is even more tricky and is considered here.
Traditional exam questions on proof are time-consuming to mark, but CAA can provide an efficient alternative. The speed and accuracy of marking objective questions and the ability to give immediate feedback are among its obvious benefits.
First we looked at a set of 50 CAA questions designed to assess mathematical proof and delivered on-line using Question Mark Perception (http://meat.csm.port.ac.uk/mcom2/)
15 questions were used for formative assessment and 20 questions for summative assessment. A significant proportion of the summative questions used the formative questions as templates and. every question had a clearly stated learning objective. We believe that
higher learning and knowledge levels were
assessed
the questions were as effective as those
traditionally delivered on paper.
Yet even in the most simple cases the learning levels are not always apparent. For example, consider the basic question:
Learning objective : to know how to evaluate the terms of a recursively defined sequence.
Evaluate the first 4 terms of the sequence t(1) = 2; t(n) = t(n-1) + n² (n>1)
The words know and evaluate appear, but the learning level is probably application (App), rather than either knowledge or evaluation. The knowledge level is procedural (P). The other questions are classified in the following table:
|
Questions |
Objective Types |
Learning Level |
Knowledge Level |
|
|
2 |
basic concept of proof |
multiple-choice, match |
K,C |
F |
|
5 |
choice of proof methods |
multiple-choice/response, match |
K,C |
F/P |
|
11 |
write proof |
order, fill-in-the-blanks, selection |
App(A,S) |
C |
|
5 |
logic statements |
multiple-choice/response |
App |
P |
|
4 |
logical problems |
multiple-choice/response |
App |
P |
|
4 |
write algorithm |
order, fill-in-the-blanks, selection |
App(A,S) |
C |
|
4 |
apply algorithm |
numeric, multiple-numeric, match |
App |
P |
Table 1 Properties of questions for assessing mathematical proof
15 questions require students to ‘write’ a mathematical proof or a computer algorithm. They seem to be above the learning level of foundation thinking and are singled out for attention. A further issue arises because, although each question has a clearly stated learning objective, two or more questions taken together may assess a higher learning level. For example, one question can ask for the identification of appropriate proof methods for different mathematical statements (Fig. 3), the next question can ask for a complete proof using an objective question (Fig. 4 and 5).
|
|
|
|
|
Fig. 3: Selection question delivered on-line using Question Mark Perception |
||
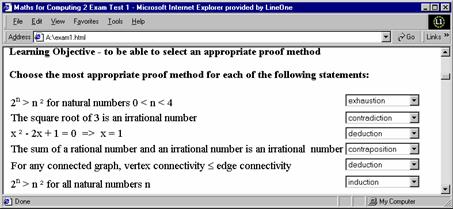
|
|
|
|
|
Fig. 4: Order Question delivered on-line using Question Mark Perception |
||
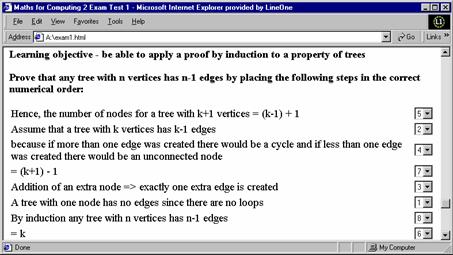
|
|
|
|
|
Fig. 5: Fill-in-blanks (assembly) question delivered using Question Mark Designer |
||
The objective questions used for assessing proofs are of the following main types:
order
- place a set of statements or groups of statements in the correct order, where
typically between 6 and 8 items are used, so that a longer proof would be
grouped
fill-in-blanks(text)
– complete several missing text or algebraic parts of a proof
fill-in-blanks
(numeric) – complete several missing numerical parts of a proof
selection
– choose from given items to complete several different parts of a proof
fill-in-blanks
(assembly) – put together a proof from a set of fragments
In the assembly question, each mathematical statement is broken into fragments, e.g. a letter for the first half and a number for the second. A proof is therefore answered as a fill-in-blanks text question in the form C4 A2 B3 D1. The example shown in Fig. 5 has been investigated by analysing the responses of 150 students.
The student scores (Fig. 6) are consistent with student abilities to generate a solution to the problem. Students who had no conceptual knowledge could not guess the proof and few students scored marks in the middle range. The spread of scores is exactly the outcome expected from a paper-based question requiring students to write out (create or synthesise) a complete proof.
|
|
|
|
|
Fig. 6: Student scores on the fill-in-blanks (assembly) proof question |
||
When scores are considered in more detail (Fig. 7) it can be seen how effective the question has been in awarding partial credit and hence in assessing lower levels of learning. For example, some students could correctly place fragments or identify the first and second lines of the proof without being able to complete the proof. Similar results have been observed for other questions of this type.
A further point is that students often use rough paper to write out their answers, especially in ordering and assembly questions, before entering their answers on the computer. This may be seen as another indicator that the CAA is equivalent to paper-based assessment. Nevertheless there are other factors to consider. In particular, we recognise that question answering might be made more direct if graphical drag-and-drop components were used to implement ordering and assembly questions to avoid the indirect use of labels. The drawback is the extra authoring time required and the uncertain benefits to be gained. Indeed it may even be more beneficial to encourage students to write out their answers on paper.
|
|
|
|
|
Fig. 7: Details of Scores on the Fill-in-Blanks (Assembly) Proof Question |
||
More advanced questions on proof include repeated statements. For example the question shown in Fig. 8 states 15 propositions and 10 reasons which have to be assembled into a 16 line proof.
|
|
|
|
|
Fig. 8: An Advanced Proof for Theoretical Computer Science |
||
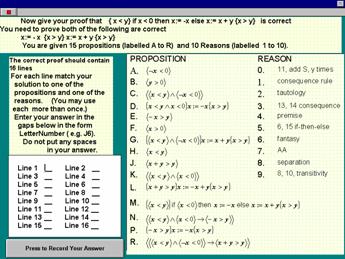
Other techniques include the identification of errors, although it is less straightforward to award partial credit and results are harder to analyse.
5 Group response systems
We have used a group (audience) response system, Varitronix PRS, to extend the use of CAA from computer laboratory to interactive classroom sessions (McCabe, Heal and White, 2001). Students enter their individual answers via a handset. Their responses are collected and a summary of results is displayed graphically for immediate discussion. The Varitronix system is limited to the entry of an integer (choice) between 0 and 9 together with an optional confidence level of high, medium or low. Other more sophisticated systems are available, but they generally lack the portability.
A group response system provides immediate feedback both to the lecturer and the class. This type of CAA delivery has been extremely valuable for revision classes where students can remain anonymous and enter their level of confidence in their answers. The lecturer gives public feedback to the whole class and the questions can later be attempted privately to obtain individual feedback. Fig. 9 shows a question delivered as part of an on-line test being used in parallel with the group response system. In this example the limitation of PRS input to a single integer means that the question can only be asked in stages, e.g. which line corresponds to the first step in the proof. Multiple choice and digit numeric questions can be asked directly, but other questions need to be adapted.
|
|
|
|
|
Fig. 9: Combined use of group response system and on-line assessment |
||
Although this seems to be a severe restriction, a major benefit of using a group response system is that follow-on questions can adapted according to the responses given by the class.
If students identify the first line of the proof successfully, then they can be asked for the second line. If they cannot, then they can be asked to identify the value of n given that nx+1 is an odd number and so on.
Group response questions are often different from standard objective test questions, in that they are specifically designed to encourage interaction. For this reason some question types, not normally used in traditional CAA, may become appropriate.
|
Question type |
Example |
Uses |
|
tryout or trial |
2 + 2 = ? |
check system, identify misuse |
|
polling |
Which proof is hardest? |
identify student problems first |
|
ambiguous |
How far is London? |
encourage student response |
|
provocative |
For what integer is n² > 2n ? |
encourage student response |
|
indiscriminate |
How many are correct? |
seek preliminary feedback |
|
ill-defined |
Solve x + y = 2 |
encourage student response |
|
step-wise |
Stages of proof/algorithm |
help answer longer questions |
|
branching |
Which part shall we do? |
flexible delivery of material |
|
evaluation |
How interesting was …? |
seek student feedback |
One question could ask which proof method was felt to be most difficult, before tackling a specific example. Another question could ask how many statements from a given list could be proved by induction. That would be pointless to ask in a summative test, since students could either identify the wrong statements or simply guess. In a formative test it does not matter. The question could subsequently be made more precise or adapted according to the answers given. Questions can also mimic “asking the audience” as used in popular TV quiz shows. and add an element of fun. In short, questioning for use in routine teaching can be made more subjective, less precise and more adaptive. We believe that the use of a group response system can be used, not only to reinforce the use of standard CAA, but also as a valuable tool for motivating higher levels of student learning.
The final word can be given to students who have been asked a range of questions to evaluate our use of the group response system, by using the system itself. A typical response was in answer to the question: “Does the use of PRS allow more class participation in revision classes?”. (1=strongly disagree 5=strongly agree). The responses shown in Fig. 10 show the strong level of agreement.
|
|
|
|
|
Fig. 10: Student feedback on group response system in revision classes |
||
Whether effective computer assisted assessment of mathematical proof provides proof of higher level learning may be open to debate. The effectiveness of group response systems in encouraging learning is less doubtful, but the extent to which it can be exploited is still being investigated.
References
Anderson, L.W., Krathwohl, D.R. and Bloom, B.S. (2000) Taxonomy for Learning, Teaching, and Assessing, A: A Revision of Bloom's Taxonomy of Educational Objectives, Complete Edition, Longman.
Beevers, C.E. and Paterson, J.S. (2001) Automatic Assessment of Problem Solving Skills in Mathematics. http://ltsn.mathstore.ac.uk/articles/maths-caa-series/july2001/
Bloom, B.S. Englehart, M.D., Furst, E.J., Hill, W.H. and Krathwohl, D.R. (1956) Taxonomy of Educational Objectives. The Classification of Educational Goals, Handbook 1: Cognitive Domain. Longmans, Green, New York.
King, T. and Duke-Williams, E. (2001) Using Computer-Aided Assessment to Test Higher Level Learning Outcomes, 5th Int. Conf. on CAA.
McCabe, E.M., Heal, A. and White, A. (2001) The Integration of Group Response Systems into Teaching and LOLA, the Missing Link in Computer Assisted Assessment. 5th Int. Conf. on CAA, http://www.lboro.ac.uk/service/ltd/flicaa
Parametric nature of mathematics’ objects
and computer environment
Vladimir Nodelman
Holon, Israel
1. The parametric nature of objects is characteristic of any science
2. The parametric approach is a powerful method of instruction
3. Computer representation of a mathematical object
The complexity of educational computerized aids; their flexibility and the dynamic features of students’ activities, essentially depend on the diversity of the learning activities provided. This diversity may be expressed by means of parameters.
1 The parametric nature of objects is characteristic of any science
The parametric nature of objects is characteristic of any science and for mathematics in particular. Underlying any subject are its basic concepts. To represent an abstract concept we may use different concrete objects.
|
|
|
|
|
|
Fig. 1 |
|
For example, triangles (a) and (b) from Fig. 1 are objects, which can be used to represent the concept “rectangular triangle”. It is acceptable to say, “Triangle (a) belongs to (associated with) the concept “rectangular triangle”. This conclusion is made possible by use of the so-called “concept recognition” operation, considered in educational psychology as one of most fundamental steps in the process of concept formation. Another example is the notion of the "non regular fraction". The definition ("non regular fraction" is a fraction whose numerator is greater or equal to the denominator) is disjunctive. That is why objects associated with this concept appear to have a different format but still remain valid representations. Thus both the fractions 5/5 and 8/5 are valid examples of this concept. Here the defining properties play the role of Boolean parameters in the object’s description.
2 The parametric approach is a powerful method of instruction
For objects associated with concepts whose definition is conjunctive, the properties are uniquely defined: all of the criteria must be satisfied simultaneously. It may seem that we lose the ability to change objects. However, there is a well-known psychological principle, which suggests that variation can be obtained by changing insignificant properties. Thus all objects shown on Fig. 2 belong to “parallelepiped” notion (which may be defined as a polyhedron with six facets and all of them are parallelograms).
|
|
|
|
|
|
Fig. 2 |
|
We may vary such properties as colour size, shape, etc., but always satisfy the two defining properties. This variation principle was used in our “rectangular triangle” example. The variable parameter there was the position of the perpendicular sides.
The approach to formation of knowledge through a range of appropriate activities goes much further.
Let us ask the student not to guess but to check the presence of properties during concept recognition exercises. In this case, counter examples become a necessary means of the concepts formation process. The formation of the concept "equation" ("equality" and " contains a variable"), for example, requires consideration of at least three types of illustrative tasks-objects for complete recognition:
Types
|
non equality |
equality which does not contain a variable |
Equation |
|
x < 5 |
2 + 3 = 5 |
Y + 2 = 5 |
|
a + 3 |
8 / 2 = 4 |
B – 3 = 6 |
|
2 + 3 > 4 |
6 = 6 |
X + Y = z - 8 |
(Insignificant properties such as the number or symbol used can be varied in parallel, emphasizing the parametric nature of these illustrative objects)
Two of them are supported by counter examples (objects from the first and the second columns do not belong to concept and only the last column consists of valid representations of the concept).
Mathematical definitions very frequently contain parameters ("quadratic function" as function of the kind y = ax2 + bx + c, etc.). Furthermore, there are a lot of specially studied topics on parameters in mathematics. Equations and inequalities with parameters are examples. So, from concepts to special topics – everywhere we have found the importance of parameters, both for the subjects and for their study.
3 Computer representation of a mathematical object
Ultimately, the computer representation of a mathematical object is carried out through the variation of numerical parameters The number of interface elements that can be used as tools for varying parameters is very limited: the edit box, radio button, check box, scrollbar and its analogue, the slider bar. –Of these, only the scrollbar allows for the "dynamic" input of values. Despite its limitations we will examine the use of the most widespread tool – the edit box.
"Algebraic expression" is probably the first and most fundamental concept based on the idea of parameter that is met in school mathematics. It is natural to introduce the edit box here. We do it using Microsoft Excel. Worksheets naturally encourage the student to enter expressions in to edit boxes (cells). Here he/she can get acquainted with the specific syntax for entering mathematical expressions into a computer and observe the change of an expression’s value in cells in response to a change of the value of parameters controlled by other cells. Students work with chains of expressions in which each successive expression is a function of the previous expression. Fig. 3 shows one such sequence which implements the expression (a + 3) 2 – 9 with cell A2 named a and the cells of row 2 containing the expressions shown in row 1.
|
|
|
|
|
|
Fig. 3 |
|
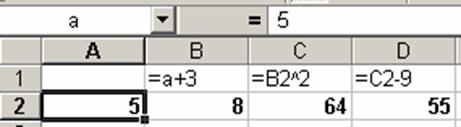
Gradually becoming more complicated, activities lead the student to construct such chains without assistance. In parallel, direct input of a parameter’s values can be achieved by typing in values one at a time using the scrollbar. Fig. 3 shows an example of such task: cell B3, named m, can be assigned its integer value from 0 to 100 by means of scrollbar. Cell G3 contains the expression (m2 - 9) / (m - 3).
The student is then required to fill in empty cells so that for any position of the scrollbar, the values of cells G3 and G6 are equal. The expression in the next cell should use the previous result and contain no more than one operation.
|
|
|
|
|
|
Fig. 4 |
|
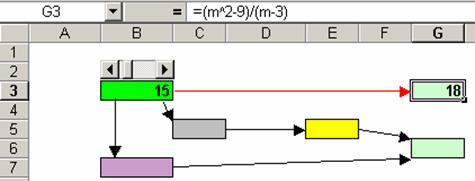
Further activities expect the student to generate the scrollbar by himself. Here the set of educational activities will lead him through a number of problems. Excel’s scrollbars do not generate negative integers. In designing an" improved input device", which allows assignment of negative and/or fractional values to cell-parameter, the student should define this cell by an expression based on the non-negative integer scrollbar position.
Having ownership of such a technique, the student will be able to develop dynamic "mechanisms" for the problem’s solution. It is known, that the habit of blindly trusting pre-prepared computer models and their results can lead to poor learning. in this case, the acquired technique frequently helps the student to find out the contradiction and solve the problem.
in the conference presentation we shall show examples of how our program "VisuMatica", can be used to help students studying mathematics from secondary up to the higher school by the active exploitation of the parametric nature of mathematical objects. There is a wide selection of appropriate interface elements and tools in this software. These include
An
explicitly viewable set of interface elements for parameter definition and
change.
A
user-friendly method for entering parametric definitions of two and
three-dimensional objects in different kinds of coordinate systems.
Presence
of “animate”, “investigate” and “family of objects”
modes based on a parametric objects’ definition, etc.
A Beta version of this program was used in some Israeli high schools this year.
4 Summary
In conclusion, it is necessary to point out that the obvious contradiction between the continuous nature of the idealized mathematical parameter and the discrete nature of its value generated by computer, always leaves a place for a critical evaluation of the achieved results.
References
Galperin, P.Ya. (1985) Instructional methods and cognitive development in childhood. Pedagogika, Moscow (in Russian).
Nodelman V. (1988) Educational software development. Minsk (in Russian).
Nodelman V. (1997; 2000) Mathematics with Electronic Workbook, vol. 1 and 2, Tel-Aviv.
Vygotsky L. S. (1987) The collected works of L.S. Vygotsky. (R.W. Rieber and A.S. Carton, Trans.). Plenum Press, New York.
The Communiversity Project
delivers a restructured pre-calculus distance learning course
Nancy J. Priselac and Stephen M. Priselac
3. Fruity investigation experiment
4. Fruity investigation conclusion
1 Communiversity
The initiative
„With the stroke of a computer key, a sparsely populated county of 29,000 is now connected to the information superhighway in Garrett County, Maryland“ (Hayes, 1995). Garrett Community College (GCC) serves about 700 full and part-time credit students and approximately 3,500 continuing education students in Western Maryland. The college has assumed a leadership role in technology, acquisition, development and distribution of services to the local community.
It was the fear of being left behind that prompted the college to create the „Communiversity,“©-a 1995 copyrighted term created by college officials to describe its role as an information hub for regional electronic access to the „universe“ of information (Hayes, 1995). GCC’s President, Dr. Stephen Herman, stated, „Recognizing the need for affordable access to information in order to be competitive in the future, the college administration has reconceived information as a public utility, as essential to community competitiveness as water, electricity and sewers“ (Hayes, 1995). Garrett Community College will serve as the catalyst for initiating, developing and providing technical support for information technology applications throughout the service area. The vision of Garrett Communiversity is to be a community service to provide affordable access to information resources for Garrett Countians anytime and anywhere.
Electronic pathways, provided through information technology, opens new opportunities for communities to access information resources on demand stimulating progress in education. The variety of information services that can be provided or significantly enhanced through an integrated community network and related information technology applications are as diverse as the missions and programs of the organizations utilizing these capabilities.
Some of the potential applications include distance learning educational opportunities with higher education institutions and students still in high school, expanded undergraduate and graduate course offerings, on-demand technical training, affordable senior citizen and citizens with disabilities courses, global art/cultural offerings, and unique professional development opportunities.
As many U.S. community colleges are facing overcrowding, GCC is gearing up to open its doors to the entire community. Though many people taking advantage of the „communiversity“ can do so from their homes, the college is offering a series of courses in mathematics and other areas that require the use of compressed video technology and a knowledge of how to take advantage of the services offered on the Internet. The communiversity is helping to create a new „global village“ that stretches far beyond the farming community where educational news once traveled largely by word of mouth to newly identified educational sites where one can choose a course or program by the pointing of a mouse.
The plan: GC2DL pre-calculus
The plan to incorporate technology, web-based homework, and cable connections to the home in a distance learning Pre-Calculus course at Garrett Community College in Western Maryland, USA was implemented Spring 2001. The GC2DL course is offered via cable to the home, to dual enrolled remote site high school students (one class each at Northern and Southern Garrett High School), a college ready class on the main campus and a college ready class at a remote campus. The course is offered in the Bell Atlantic fiber optic MIDLN (Maryland Interactive Distance Learning Network) classroom at each of the four sites. These classrooms resemble TV studios where students communicate among studio sites in real time. Technological tools are available to aid teachers and students in content delivery. Computers with Internet access, electronic whiteboards, graphic calculators, laptop computers, laser discs, document cameras, VCRs, and flatbed scanners illustrate some of the technology used in each classroom. Research has not yet indicated which technology tools actually make learning efficient and more enhanced, but as a practitioner, this instructor knows that appropriately selected technology can work together transparently and seamlessly to enhance classroom learning. Electronic learning environments in both public and higher education settings are changing the current learning paradigm from that of information transfer to a new paradigm which actively engages the learner and uses technology to enhance learning for each individual. However, distance learning design concerns should always contain some basic considerations. Hart (1996) describes a survey of University of Hong Kong faculty members that investigated preferences for classroom features. There was little agreement on the „perfect“ technology based classroom. Riley and Gallo (2000) conclude that the best technology solutions can’t be effective if the learning environment is not comfortable.
Reflecting on current and expected changes in pedagogy and technology, Blackett and Stanfield (1994) advocate remembering three principles for general classroom planning: 1) plan for the full range of teaching methods, 2) plan for change and flexibility, and 3) focus on the exchange of ideas and acquisition of knowledge. Wilson (1993) reported the thoughts and projects of higher education professionals exploring the issue of high-tech classrooms. He discusses that distance learning (DL) inclusion in a schedule is an indication that the industry and academia have welcomed technology as a method of making the training and education process more effective, efficient and immediate. According to Wilson, institutions and companies refusing to adopt technology as a part of their training strategies are now viewed as archaic and non-conformist.
2 Distance learning
Presentation of the distance learning segment
The presentation team will provide participants with a multi-media slide show which will depict a panoramic view of the: 1) Bell Atlantic Fiber Optic MIDLN Classroom, 2) Interactive Video Network (IVN) Compressed Video Classroom, 3) High Speed Interactive Conference/Classroom, 4) The Multi-Media Mathematics Classrooms 1 and 2, 5) Mathematics Media Resource Center, and 6) other locations with high technology support for learning mathematics. Next the team will show Pre-Calculus instructional support slide shows prepared by the instructional team using WordPerfect Presentations or Authorware. A sample of derive labs and web-based Mathwright homework labs will be presented. Participants will receive a free CD with the entire presentation at the conclusion of the program.
Assessment and pre-calculus
The GC2DL Pre-Calculus course is a college level multi-media distance learning mathematics course sequence offered for both high school and college level students simultaneously in different locations. The Garrett fiber-optic electronic classrooms (e-classrooms) were funded in part, including all electronic equipment, by a grant from Bell Atlantic (1994). Each classroom has the same color scheme and the same electronic support system which allows the teacher to control front and rear cameras, fax machines, VCRs, and document camera during classroom presentations. The purpose of the GC2DL Pre-Calculus Course Project is to enable public school students to remain in the mathematics pipeline while in high school by providing a smooth transition into college level mathematics after the completion of Algebra II. Dual enrolled high school students receive a fifty percent reduction in college tuition which is an added incentive to take college level courses.
Placement testing (COMPASS, or Accuplacer) is mandatory for all students entering the Community College System in Maryland. Garrett Community College requires the COMPASS (Computer-adaptive Placement Assessment and Support System) developed by ACT (ACT, 1994) and uses their national cut-off scores for placement.
The GC2DL Pre-Calculus course was designed by the Garrett Community College Mathematics Department Chair with assistance from Garrett Community College and Garrett County high school faculty. The structure of the course allows for traditional and non-traditional student enrollment. Students may take the course via cable or attend an e-classroom. A maximum of four e-classrooms can be connected for each teaching episode, allowing students to see and hear each other on TV monitors located in each classroom. The teacher identifies what needs to be learned and the student helps identify the means by which the learning occurs.
Educators and administrators from both Garrett Community College and the Garrett County Public School System served as a planning committee for the distance learning project. Principals from both high schools and the college academic dean are a part of the planning team which reviews distance learning courses on an annual basis.
It is quite common for the drop/fail/withdrawal rate of traditional, college/university entry level mathematics courses to fluctuate between 40 and 60 percent. Since this Pre-Calculus course is primarily designed for the student not in the AP track at the high school, it is important that college algebra be a pre-requisite for this course. College level students, including adult learners who passed the placement test, can take the course with high school students. It is not the intent for the GC2DL Pre-Calculus course to replace mathematics courses offered in the high school curriculum. The GCC Mathematics Department developed distance learning College Algebra for the fall semester and Pre-Calculus for the spring semester each year starting in Fall 1996. The new multi-media distance learning pilot of the GC2DL began in Fall 1999 with the College Algebra course and continued through Spring 2000 for the Pre-Calculus course.
Pre-calculus project with graphing calculator technology
It was important to add a curriculum activity which connected mathematics, technology and health science since there are many aspiring health professionals taking pre-calculus as a prerequisite in their program. Human nutrition is grounded in the principles of biology and chemistry (Spallholz, 1989) and is rich in opportunities to apply mathematical concepts (Rye, 1998). Accordingly, a focus on human nutrition provided for the development of cross-disciplinary science concepts which could be analyzed using the Casio 9850PLUS graphic calculator. The activity, as developed by Rye, was incorporated into the pre-calculus curriculum. This activity allowed for the following outcomes. Students will:
list and define basic concepts that underlie and
are critical to the design of an experiment;
devise and apply a formula necessary to „makeup“
a solution containing x% concentration by weight of a solute (e.g., sugar);
calculate and interpret various descriptive
statistics for experimental data;
calculate density from experimental data of mass
and volume;
apply the concept of „percentage by weight“ to
the calculation of water and/or sugar content (mass) of living things and
foodstuffs;
approximate the kilocalorie value of fruits,
based on weight and food composition data;
design and carry out other experiments that
attempt to answer questions that have emerged from the investigation.
3 Fruity investigation experiment
This investigation seeks to determine the sugar concentration of a solution at which a grape will become buoyant. Box and whisker plots of the data are generated to illustrate the range of values produced by each small group that completes the experiment and to discuss the concepts of median, quartile, percentile, natural variance, and experimental error. Hypotheses are set forth about the sugar concentration of different types of grapes (e.g., white as opposed to red), and the independent sample t-test was applied to the data generated from experiments determining the sugar concentration in randomly selected grape samples. The data shown in Table1 was generated by the students who completed this experiment. The „percent mass as sugar of solution at buoyancy“ approximates the actual sugar concentration of the grapes–approximately 18% according to food composition tables (e.g., Pennington, 1998). Further discussion can be generated about „body composition“ (percent mass as water) of grapes (about 80%) as opposed to humans (50 to 60%), which leads to an appreciation of water as the nutrient needed in the greatest quantity by humans. Table 1 represents Mass (g) of Sugar Added to Water to Achieve Buoyancy, Mass (g) of Sugar Solution at Buoyancy and Percent (%) Mass at Sugar of Solution at Buoyancy.
|
Group |
Sugar added to water [g] to achieve buoyancy |
Sugar solution [g] at buoyancy |
% sugar at buoyancy |
|||
|
Grapes |
Grapes |
Grapes |
||||
|
Red |
White |
White |
Red |
Red |
White |
|
|
1 |
11.0 |
11.5 |
69.7 |
70.8 |
15.8 |
16.2 |
|
2 |
11.5 |
12.0 |
81.6 |
81.7 |
14.1 |
14.7 |
|
3 |
14.0 |
15.0 |
75.0 |
76.0 |
18.7 |
19.7 |
|
4 |
11.5 |
12.5 |
70.3 |
75.5 |
16.4 |
16.6 |
|
5 |
15.5 |
14.5 |
66.2 |
65.2 |
23.4 |
22.2 |
|
6 |
10.0 |
9.0 |
72.9 |
72.8 |
13.7 |
12.4 |
|
7 |
10.0 |
12.0 |
72.9 |
72.8 |
13.7 |
16.5 |
|
8 |
15.0 |
18.0 |
84.0 |
87.0 |
17.9 |
20.7 |
|
9 |
16.0 |
17.5 |
76.5 |
76.1 |
20.9 |
23.0 |
|
10 |
11.5 |
12.5 |
11.5 |
12.5 |
16.0 |
17.2 |
Table 1: Fruity Investigation Data and Respective Calculations
4 Fruity investigation conclusion
Through this investigation students learn the experimental design and nutrition concepts via an exploration of the buoyancy of grapes in various concentrations of sugar water. The investigation emphasizes math/science interrelationships and yields data to approximate the water and sugar composition, kilocalorie value, and the density of grapes. This activity affords the students an opportunity to place the data in the list menu of the graphic calculator. The data is then transferred to the statistics menu for analysis purposes. Box and whisker plots allow students to analyze the median along with first and third quartile data. Mean data statistics can also be generated and used for discussion purposes.
Reading assignments: The GC2DL Pre-Calculus course uses the Addison Wesley, Algebra and Trigonometry 6th Edition textbook by Keedy, Bittinger, and Beecher (Chapters 6-11) for the skill portion. Other textbook options will be investigated as course development continues.
Mini lecture/problem-solving activities: The GC2DL Pre-Calculus course is using a series of mini lectures, multi-media slide shows, CDs, videotapes, and problem-solving activities such as the mirror problem and the handshake problem created and used by the instructor since 1996. Well-scripted lectures are important since the course is viewed by Cable, Channel 99, subscribers.
Instructor E-mail, web-based and other electronic communication: The instructor will provide a web-site (http://www.gcc.cc.md.us/math/dstlearning/) where students will access assignments, activities, and research information. Students will also communicate with the instructor via telephone (301-387-3045), e-mail (npriselac@gcc.cc.md.us), and fax machines (office 301-387-3189) and (campus 301-387-3055). The Math Center is open from 8:30 a.m. until 6:30 p.m. Monday thru Friday and by appointment on weekends.
Critical thinking/computer homework activities: Students are instructed with a computer software package, Derive. The Derive introduction activity is offered during class time. A minimum of three selected laboratories are required as homework assignments: (a) Trigonometric Functions, (b) Symmetry, and (c) Functions.
Interactive computer activities with on-line activity sheets: The Spring 2001 GC2DL Pre-Calculus course will use a newly generated instructive set of computer homework activities developed by a team of instructors at West Virginia University (WVU) for use in their web-based Pre-Calculus course. Students will use the Mathwright (free ware) software package for laboratory homework assignments. These laboratories will be used to develop mathematical reasoning skills. They will emphasize connections among numbers in tables, algebraic analysis, and graphs. Since many GCC math students transfer to West Virginia University in a variety of engineering programs,
GCC formed a partnership with WVU to use the computer laboratories required on the WVU campus.
Homework activities: Homework assignments are posted on the web
(http://www.gcc.cc.md.us/math/dstlearning) Assignments include a research paper and a 3-D project. Chapter tests from the book are graded as quizzes. Projects, laboratories, and research activities are all graded as homework assignments.
Tests: Tests are given at the end of each chapter in a supervised setting. Students taking the course via cable must come to campus to test. Students must obtain a 70% score on the departmental exit exam to successfully complete the course.
Grades: The student grade will be determined by the instructor of record based on the exit exam. Averaging of tests, quizzes, projects, homework, and laboratories occur only if the exit exam is passed with a minimum 70% competency as defined in the course syllabus.
5 Summary
We must continue to research major factors in distance learning instruction that have an effect on satisfaction, teaching and learning. These factors include ergonomics, environmental conditions, faculty training, staff partnerships, seamless fusion of technologies and technology integration into the curriculum.
According to Coppola and Thomas (2000), among the expected changes in the world of higher education are: established standards of learning proficiency; a focus on what students really need to know; an individual learning plan for each learner; more instructional time; varied technology to help students master their learning goals; a better system of diagnosing learning difficulties and prescribing effective remedies; more individualized instruction for skills learning; a focus on lifelong learning; and more collaborative group learning. Teachers must become facilitators of learning rather than disseminators of knowledge.
The e-classroom designed by Bell Atlantic may seem like a large capital outlay but it is not much higher in cost than a typical instruction-based computer classroom to furnish and equip. The per room operational cost via a dedicated compressed video network with appropriate band-width has created a high cost factor which must be recognized.
In the last two decades of the 20th Century, educators have watched things like computers, the internet, and multi-media presentations change the method and practice of education at all levels. It stands to reason that the next decade will provide us with possibilities and challenges we cannot yet imagine. Presentations are going beyond basic multi-media slide shows. Attention is now directed toward assessment as we document how students learn, and how teachers teach. Keep that thought and reach out and touch the future.
References
ACT ( ) Compass Support Services - Educational Technology Center. http://www.act.org/
Bell Atlantic (1994). Interactive Distance Learning Workshop. Indiana University, Indiana.
Boettcher, J. V. (1999) 21st Century Teaching and Learning Patterns: What Will We See? Syllabus 12(10).
Blackett, A. and Stanfield, B (1994) A Planner’s Guide to Tomorrow’s Classrooms. Planning for Higher Education 22(3), 25-31.
Coppola, Jean F. and Thomas, Barbara A. (2000) A Model for E-classroom Design Beyond Chalk and Talk. T.H.E. Journal.
Hart, I. (1996) Building the Perfect Classroom, or the Labors of Sisyphus. College and University Media Review 2(2), 11-21.
Hayes, Diana W. (1995) Garrett Community College Creates ‘Communiversity.’ Community College Week 1.
Pennington, J. (1998) Bowes and Church’s Food Values of Portions Commonly Used.: Kluwer, Hingham, MA.
Riley, P. and Gallo, L. (2000) Electronic Learning Environments: Design Considerations. T.H.E. Journal.
Rye, J. (1997) Grape expectations. Science Teacher 64, 42-46.
Spallholz, J. (1989) Nutrition: Chemistry and Biology. Prentice Hall, Englewood Cliffs, NJ.
Project Zero: Developing online material
for mathematics teacher education
Alfred Schreiber
Flensburg, Germany
1
English version of the paper (4 pages, cf. Proceedings ICTMT 5)
1. Starting point and aim of the project
3. Outline of the CBT- Module („Aufgaben-Trainer“)
4. Computer-based training frames
Full version of the contribution (german)
Homepage ZERO – Mathematics Online
2
The author's workshop (contains more about CBT, DUAL and ZERO)
The author's personal homepage
This paper reports about a project dealing with the conception and production of supplementary learning material for mathematics teachers. It surveys the various types of courseware-modules presented herein online (e.g., dynamic geometry, computer-based-training-like frames, paper-and-pencil-exercises), and discusses their specific purpose and use. Emphasis is put on the problem of how to embody appropriate functions that provide the opportunity to evaluate user inputs - thus enabling an author to give "local" feedbacks to the student. Finally, some questions are raised concerning the form that should be used in the future to represent both data and logical structure of the underlying content.
1 Starting point and aim of the project
Beginners often find it hard to integrate new and unfamiliar mathematical concepts and methods into their knowledge from school. Solving problems and exercises in training groups therefore usually plays an important role in overcoming these initial obstacles. Such mathematical activities, however, will be successful only if their focus is on genuine problem solving rather than on skills and routines. As, on the other hand, the acquisition of routines may not be simply neglected, the idea arose making online available appropriate exercises in various formats and on various levels. With this supply students should be given the opportunity to control and assess themselves and to practice according to their own needs. In order to pursue this aim Zero has been started in 1996/97 as a small project at the University of Flensburg. In what follows I intend to give a survey of the content and the sort of interaction to be found in it; then, looking behind the curtain, I shall put forward some of its driving wheels and levers.
2 Survey of the contents
Zero has its own web site (http://www.uni-flensburg.de/mathe/zero/zero.html) on which are presented learning materials of three categories:
Lecture notes
Links: „Veranstaltungen“, „Literaturhinweise“. —Some dozens of chapters from various courses have been transformed into web pages, a stock continuously maintained and to be extended in the future. Emphasis on logical structure was decisive in choosing HTML (though page layout is rather limited and display of formulae nearly impossible). The HTML files contain text, graphics, links (to references and remote sites), Mathematica notebooks, and dynamic figures.
Exercises
Links: „Übungsaufgaben“, „Aufgaben-Trainer“. —The collection of exercises currently (June 2001) contains round about 300 items covering the central topics from the introductory courses, e.g., natural numbers and induction, integers and divisibility, the concept of function, some elementary combinatorics, algebra, and geometry. Items concerning heuristics and didactics will be added later. The exercises are for the most part elementary. From a technical point of view three main types have to be distinguished:
Paper-and-pencil-exercise:
The learning task has no special format. The student may receive help (i.e., a
hint at how to solve the problem) and get a solution on demand.
Dynamic-geometry-module:
A dynamic figure is presented together with a question or exploratory task. In
some cases individual feedback is provided to different responses (actions).
Computer-based-training-frame:
A learning task is presented within a frame where the student makes his or her
input, which then will be analysed and commented. This procedure may be iterated.
I am aware that none of these categories is a magic pill to cure our ills or is even free of shortcomings; and, of course, there are further formats (e.g., simulations) which could be used with at least equal benefit. However, it seems acceptable to offer a versatile mixture the quality of the whole depending heavily on the quality of its ingredients.
Supplements
Links: „Figuren-Galerie“, „Mathematiker-Galerie“, „Denkzettel“. —This kind of content is organized in three sections: a gallery of mathematical objects (up till now mainly dynamic geometry), a gallery of mathematical people (with concise comments on their lives and work), and „denkzettel“, a sporadically growing collection of miniatures concerning the relation between mathematics and the ‚rest of the world‘ (e.g., art, literature, science, philosophy, pedagogy). The „denkzettel“s stand open for contributors from outside, and open up an experimental field beyond any kind of bureaucratic habits whatsoever, thus offering an opportunity for prospective teachers to develop a more flexible and as well intellectually as emotionally a richer relation to mathematics.
3 Outline of the CBT- Module („Aufgaben-Trainer“)
The „Aufgaben-Trainer“ (exercise-coach) can be downloaded from the Zero-site. It is a program for testing and practicing currently comprising 120 exercises (arithmetic, algebra, no geometry) to be used offline. For online use 70 percent of the exercises have been prepared as CBT-style frames.
The software is based on an abstract adaptive tutoring system (DUAL), which has been developed since 1991 and described in greater detail in Schreiber (1992 and 1998). The system is built up as a three-tier application with the following layers: 1. a relational database model, which contains the items to be presented as exercises, 2. a tutoring module, which processes the inputs/actions of the student and decides what to do next, 3. a visual front-end serving as the communication interface between student and system. On a closer inspection, in the second layer, there are two components working together:
1 A MacroTutor decides, on the basis of data up till then produced by the student’s actions, which item to present next, thereby using a special teaching algorithm. There is a slot allowing such algorithms (called teaching strategies) to be selected on demand. Since the user gets access via a personal password the system can process his/her data individually.
2 A MicroTutor presents the frames (items) requested by the MacroTutor. The item ‚points‘ to the frame-type (e.g., multiple-choice, matching and free-text questions) and the external data needed for the presentation. So, the MicroTutor’s cyclic four-stage-process (fig. 1) can be started the result of which, finally, returns to the MacroTutor.
From the beginning, basic ideas with the design and development of the system had been a logical description of instruction (cf. Eckel 1993, Schreiber 1990) and the separation of the components (cf. Schreiber 1990, 1992). By consequence, the MicroTutor is able to do his work without the MacroTutor. Practically does this mean that programs (clients) may call individual frames from any DUAL-project outside—a significant feature not shared by those authoring/tutoring systems which use a combined structure of content and logical data.
|
|
|
|
|
Fig. 1: Schematic structure of the tutoring system DUAL |
||
4 Computer-based training frames
In order to be able to present the various frames (exercises) from the „Aufgaben-Trainer“ on the web the MicroTutor had to be re-developed as a Java applet. The following types of frames are supported by the new module: true/false questions, multiple-choice-frames of both types ‚1 out of n‘ and ‚k out of n‘ (with choices in random order), injective and non-injective mappings from one set of objects to another (fig. 2), free-text questions and fill-in-exercises with single- and multiple-string answers.
The frame-content is stored in a relational database and can be retrieved by the MicroTutor. A record of such frame-data not only contains texts and images needed for the display but also specific information concerning the internal logic of the frame, e.g., a set of rules prescribing how to judge the student’s response. The MicroTutor uses two kinds of procedures: general schemes that apply to all types of frames, and specialized routines for the processing of type-dependent data.
Remark — A short remark on response analysis shall illustrate this. As I have shown in (Schreiber 1998), one uniform method applies for the various forms of matching and multiple-choice, whereas the evaluation of arbitrary alphanumeric inputs is an entirely different task requiring its own sophisticated routines. The possible answers of a free-text question, for example, have to be known in advance. By means of Boolean and fuzzy operators, the author may define classes or patterns of strings and add them to the database (for details cf. Nesbit 1985, Schreiber 1998). Judging a given answer means testing whether it belongs to one of these predefined classes or not. If not, then the answer has to be judged as ‚not yet understood‘ though it might be correct. This is a shortcoming all kinds of pattern matching have in common (even those using semantic methods, since no user can be prevented from intentionally entering nonsense). What I learned from experience is a twofold advice: to expect, optimistically, reasonable inputs from students, and to choose the context of the problem so as to confine the range of potential inputs.
|
|
|
|
|
Fig. 2: Example of a Frame of Type ‚injective mapping‘ |
||
5 Dynamic Geometry modules
These elements (interactive work sheets, exercises) have been developed using a special class library of dynamic geometry methods. Authors can rely on flexible facilities for ‚scripting‘ the figures and interfacing to Java/JavaScript. For more details cf. Ehmke 2001 and the contribution of T. Ehmke in this volume.
References
Alessi, S. M. and Trollip, S. R. (1985) Computer-Based Instruction. Methods and Development. Prentice Hall, Englewood Cliffs, New Jersey, 2nd ed. Allynand Bacon.
Eckel, K. (1993) Instruction Language. Foundations of a Strict Science of Instruction. Educational Technology Publications, Inc., Englewood Cliffs, New Jersey.
Ehmke, T.(2001) Eine Klasse beweglicher Figuren für interaktive Lernbausteine zur Geometrie. PhD Diss. University of Flensburg.
URL: http://www.uni-flensburg.de/mathe/homepg/schreiber/projekte/projekte_index.html
Nesbit, J. C.(1985) Approximate String Matching in Response Analysis. Journal of Computer-Based Instruction 12, 71-75.
Schreiber, A. (1990) Bausteine für Lernprogramme: Beschreibung und Implementierung. Informatik- Fachberichte Nr. 259. Springer, Berlin, Heidelberg, New York, 333-348.
Schreiber, A.(1990) Review of Eckel (1993) Zentralblatt für Didaktik der Mathematik 22, 114-116
Schreiber, A.(1992) Eine Didaktik-Umgebung für Adaptives Lernen (DUAL). Grundlagenstudien aus Kybernetik und Geisteswissenschaft / Humankybernetik 33, 25-31.
Schreiber, A. (1998) CBT-Anwendungen professionell entwickeln. Springer, Berlin.
Mathematics and the Internet
Peter van Wijk and Hans Stam
Utrecht, The Netherlands
 APS is
the National Center for School
Improvement.
involved in all kinds of
projects, working with teachers and school board members to improve the quality
of the schools en the quality of teaching.
specialized in implementing new
curricula in the classroom, focussing on Mathematics, Science and Technology,
Physical Education and Languages
More information: www.aps.nl > APS international pages.
2. Web-sites as starting points for mathematical activities
1 Ways to use the Internet
The Internet is primarily used as a source of information, as reference work and as a medium in which to look things up. There is, it is true, a lot to be found on the Internet, but for (arithmetic) education the Internet can be more than an encyclopaedia or library. In order to organise the various ways in which the Internet can be used in education, we take the classification based on the idea that there are various sorts of places on the Internet.
Where education is
There are places on the Internet where you can find ready-made education. You can send students to one of these places and they can get to work straight away. You don’t have to do much as teacher. This ready-made education might be:
a research or practical assignment
a series of lessons
exercise material
Places where education can be downloaded
The Internet also functions as a distribution channel for material, which can be used in the mathematics lesson. You can go to one of these places on the Internet and download various materials, including the following:
Software: some software is free and some
is not; this might include downloading new versions and programs for a graphic
calculator
tests: sometimes you have to be a member
to be able to download these and sometimes you can download tests free
"paper" teaching materials such as
worksheets: You can download something, adapt it if you want, print it out
and use it in the class; publishers, amongst others make such materials
available.
Things you can use to 'make' education
Most web sites are not made for mathematics education, but do contain information you can use for mathematics. With a little creativity you can incorporate the information provided in your mathematics lesson. The Internet is, then, a source of information and inspiration:
topical information: this might include
information on the weather, traffic, sport, stock exchange prices, etc.
background information: as reference
material, the same function as a library, encyclopaedia or newspaper.
Things you (as teacher) can learn from
The Internet can also be used as source of information for updating or expanding your own knowledge. You can keep yourself informed and learn new things in various ways via the Internet. Information can be found via web sites on all sorts of things, including the following:
new developments: this might include
examination syllabuses, in books, upgrades of software agenda of conferences
and meetings
courses: you can also follow courses via
the Internet in order to stay up-to-date with regard to subject content.
mathematics subjects and persons: there
are various good mathematical encyclopaedias to be found on the Internet
the subject: what is going on elsewhere
(at another school, abroad) with regard to mathematics.
The Internet as a means of communication
In the above we have described four types of places, which can be found, on the Internet. Each one can be used in some way for the mathematics lesson. In fact, if you surf the Internet, you will see that there is continual communication: information is exchanged over the physical Internet. Via the Internet you can send electronic letters in the form of e-mail messages; you can also discuss things with colleagues. The Internet offers more than just passive information. You can also:
ask questions, to experts or colleagues
cooperate with colleagues nearby or far away
keep each other informed
exchange experiences
discuss things
2 Web-sites as starting points for mathematical activities
Few web sites have been set up specifically for mathematical education, but many do contain information, which can be used for mathematics. This type of web site then functions as a context or source. On the Digital School web site, there is an overview of all sorts of sites, which can be used as sources for mathematical activities. Increasing numbers of companies provide their information and services via the Internet. The information provided is suitable for use in mathematics education. But there are also newspapers on the Internet. In other words, the Internet is an exceptionally rich source of contexts. A great deal of information can be found on it and this information is realistic and topical. Characteristic of this type of sites is that you have to make worksheets to enable the mathematical content to emerge. On the following pages we provide a number of examples of worksheets, which are suitable for this type of sites.
3 Examples
Homepage of the weather institute in the Netherlands
Introduction: The homepage of the weather institute in the Netherlands (KNMI) is active in all sorts of matters relating to the weather and the climate. Amongst other things, they make weather forecasts for the coming week. Go to the KNMI homepage: http://www.knmi.nl/ This page has four sections: "Onderzoek", "Voorlichting", "Organisatie" and "Data & produkten". Go on to "Voorlichting". You should be able to find information about the previous month here. We are going to collect information on the amount of precipitation, the changes in temperature and the number of hours of sunshine in the previous month.
Assignment 1
On what day did the most precipitation fall?
On how many days was there no precipitation?
How much precipitation fell in the whole month?
Assignment 2
What were the maximum and minimum temperatures
on the 16th of the month?
What was the maximum number of hours the sun
could shine on the 7th of the month?
On how many days did the sun not shine at all?
On what day was the difference in temperature
the greatest?
Was it a sunny month?
What conclusions can you draw with regard to the
previous month if you look at he precipitation and the changes in temperature?
Extra assignment
If you look carefully at the graph of the temperature, you will see that the graph of Tavge (average temperature) is not always precisely half way between that of Tmin (minimum temperature) and Tmax (maximum temperature). Try to reason out how the graph of Tavge is drawn.
Platonic bodies
Introduction
There has always been a great fascination for symmetry, not only for flat figures such as triangles, but also for three-dimensional bodies. This interest goes as far back as ancient Grecian times. Pythagoras was the first to construct various regular polyhedrons. A polyhedron is a three-dimensional body, which is limited by polygons (triangles, rectangles etc.). Regular polyhedrons have interesting properties, which are related to symmetry. There are five regular polyhedrons; they are also known as Platonic bodies: the tetrahedron, cube, octahedron, dodecahedron and icosahedron. The objective of this assignment is to study what makes the regular polyhedrons so special.
Assignment
Look for pictures of, and information about, Platonic bodies on the Internet. Find answers to the following questions, as a minimum:
What do Platonic bodies look like?
What do the cutouts for Platonic bodies look
like?
What properties does a polyhedron have to meet
to be a Platonic body?
Why are there only five Platonic bodies?
What (non-mathematical) matters were associated
with Platonic bodies in the past?
The following sites could be used as starting points for your search for information:
http://www.teleport.com/~tpgettys/poly.html
http://www.mathconsult.ch/showroom/unipoly/index.html
http://www.darkwing.uoregon.cdu/~koch/pictures/pictures.html
http://www.ics.uci.edu/~eppstein/junkyard
Presentation
Design a poster on the Platonic bodies. This poster must show at least illustrations of the five Platonic bodies and answers to the above questions.
The Fibonacci sequence
Introduction
In 1202, the Italian mathematician, Leonardo di Pisa, better known as Fibonacci, formulated the following problem: A farmer buys two young rabbits at the market in Pisa: one is a male and one a female. In the first month, the two rabbits do not produce any young, but after the second month, the first two rabbits are born: a male and a female. During the successive months this first pair of rabbits repeatedly produces two rabbits of a different gender. But, once the offspring of the original pair are a month old, they also reproduce and bring a pair of rabbits into the world. Fibonacci wondered how many pairs of rabbits the farmer would have in the successive months, assuming that none of the pairs of rabbits die. The number of rabbit pairs in the successive months form a sequence, which is known as the Fibonacci sequence. In addition to a number of striking mathematical properties, this sequence also has unexpected relationships with regular patterns outside mathematics, which are often more realistic than the growth of the above-mentioned rabbit population.
Assignment
Make a table with the first 15 numbers of the
Fibonacci sequence.
What connection can you see between three
successive numbers?
Draw up a recursion equation, which describes
the Fibonacci sequence.
Compare the Fibonacci sequence with its string
of differences. Explain the similarity between these two sequences.
Find another remarkable connection between the
numbers in the Fibonacci sequence and explain this connection.
Examine the connection between the Fibonacci
sequence and the Golden Section.
Examine whether this connection depends on the
choice of the first two numbers in the sequence.
Describe examples from nature in which the
Fibonacci sequence plays a role.
Write a short sketch of Fibonacci’s life and the
role he played in mathematics.
You can use the following Internet sources:
http://www.mcs.surrey.ac.uk/Personal/R.Knott/Fibonacci/fib.html
http://home.planetinternet.be/-donatus/digikids99.htm
http://www.history.mes.st-and.ac.uk/history/
Presentation
Write a project on the Fibonacci sequence. The project must at least include the aspects mentioned above. The whole must take the form of a cohesive unit and be accompanied by an explanation, which is clear enough for someone without any prior knowledge of the subject matter to follow.
The history of the number p
Introduction
A number of assignments are given below which have to do with the history of the number p. Process the answers to these assignments into a continuous essay.
The number p has been connected with the circumference and surface of a circle as far back as ancient times. It was expressed as a fraction with a numerator and a denominator up to the Middle Ages.
Assignment 1
a) A well-known approximation of the number p expressed as a fraction is: p = 22/7. To how many decimals is this approximation accurate?
b) Go to http://www.wiswijzer.nl/ on the Internet and select "Wiskunde".
Further down on the page you now see The History of p for class 2.
Find out here what other approximations of p have been made using fractions.
State to how many decimals these approximations were accurate.
After the introduction of differential and integral calculations in the seventeenth century, totally new ways of computing the value of the number p were found. The next assignment is about these.
Assignment 2
Agreement: We call the inverse function of f(x) = tan(x), g(x) = arctan(x)
c) Calculate arctan(1), arctan(Ö3), arctan (1/Ö3)
d) Draw the graph of g(x) = arctan(x) at the interval [-10,10]
In 1671, the mathematician, Gregory (1638-1675) proved the following formula:
![]()
This progression of arctan(x) is called Gregory’s Formula and only applies for -1£ x £ 1
It is possible to compute the value of p using Gregory’s Formula.
Assignment 3
e) Show that you can compute the number p using Gregory’s Formula through the following progression:
![]()
This is called Leibniz’s Formula (1646-1716).
f) Prove the following using Gregory’s Formula:
![]()
This is called Sharp’s Formula (1651-1742).
Assignment 4
In general, you have to make extensive calculations using the formulas from assignment 3 to compute a reasonably acceptable approximation of the number, p.
g) Calculate the first twenty numbers of Leibniz’s Formula with a calculator. Add them up and compare the outcome with the value of p / 4
h) Do the same for Sharp’s Formula.
i) Find out what happens if you use Gregory’s Formula to compute p / 3 with the aid of a progression.
The following formula comes from the mathematician Euler (1707-1783).
![]()
Webquest
Freudenthal Instituut
|
|
|
|
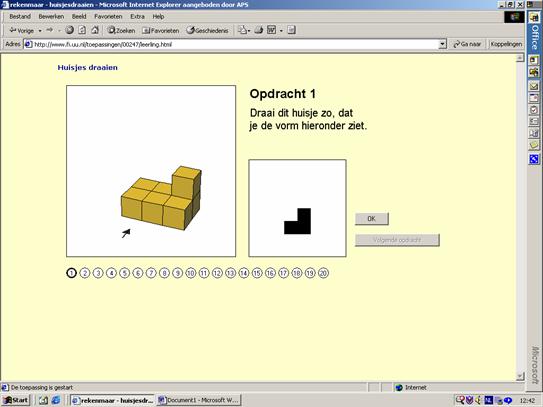
www.fi.uu.nl/toepassingen/00247/leerling.html
Online mathematics teaching:
The development of student instructor interaction
A. Waterson and E.R. Smith
Bundoora, Victoria, Australia
2. A model for problem assistance
3. Examples from a subject on fluid mechanics
1 Introduction
We learn mathematics by “doing” mathematics, by which we generally mean solving problems after having worked through lecture note or book material. Solving problems is usually carried out in problem classes where students can work at problems and call for the help of a tutor or demonstrator when they become stuck. This teacher will (in “best practice”) lean over the student’s shoulder and try to help them. Preferably, teachers will not help too much, because it is important that students feel they have control over how they work through a problem. Too much help can take away their sense of achievement in solving a problem themselves and make students need to feel they have lost control of their own learning. A light hand is needed in offering help and guidance.
When we teach mathematics online (rather than onsite), we no longer have the capacity to watch over students as they work through problems. While various communications tools in teaching software allow you to communicate with students via chat rooms, threaded discussions and e-mails, none have the necessary immediacy for helping problem solvers. We propose a style of online problem class, which resolves these problems of student control of help and immediacy. Our experience is with using WebCT, but the ideas we describe here should work equally well in any such program.
There is a wide difference between traditional distance learning, usually mediated by written interchanges via a postal system, and online teaching, where a certain immediacy of response is possible and expected. Using online teaching frees you from some of the problems associated with exchange of written material; in particular one may provide extremely full explanations at no cost in paper. Mind you, the material must be organised well and should be delivered in reasonably small portions. If we assume all that, we have still not solved the problem of how to help online students working through problems.
2 A model for problem assistance
Our idea is to present problems with solutions in “layered” guides. For each problem we provide a “Level 1 Solution Guide”. This restates the problem, provides a set of “hints” or additional information, which we think an average student may need, and then displays a set of “waypoints” that a standard solution to a problem will need to get to the end.
The first thing this level 1 guide offers a student is a link to a full solution. This is designed to be long-winded and exact in all it shows, encouraging students to do things on their own. That carries the risk that the student will merely look at it and read it cursorily. This happens in onsite problem classes too, but student pride will have some effect on them as they develop independent skills. As long as they have choice, good sense will win more often then we normally expect. After each waypoint in a level 1 guide, there is a link to a level 2 guide that gives fairly fine detail about how to get to this new level 1 waypoint. In some cases, trying to stretch students more, these level 2 guides are themselves sparse, with links to level 3 guides to connect points. We also use level 3 guides to give short introductions to mathematics that some students haven’t met.
Essentially, the layered set of solution guides covers everything in the full solution, but the student has complete control at all stages of how and when to call in help if they need it. The layered guides are constructed by dissecting the full solutions appropriately.
3 Examples from a subject on fluid mechanics
Our layered solution guide system is a simple idea, but the details are important. We have constructed a subject on mathematical fluid mechanics. Its emphasis is on developing modelling skills, solving problems in vector analysis and simple differential equations. The subject assumes knowledge of basic vector calculus with grads, divs and curls and the Gauss’, Stokes’ and Green’s theorems. The subject has a variety of advanced topics included, so that it can also be used at introductory graduate level. The main source for the subject was Landau and Lifshitz (1959). The subject contains:
|
|
Topic |
Details |
Advanced Topics |
|
1 |
Deriving the basic equations which describe Fluid Flow |
Navier Stokes’ and Continuity equations, incompressible fluids |
|
|
2 |
Boundary Conditions on Fluid Flow (with a section on hydrostatics) |
Comparison of Potential flow approximations and stick boundary conditions |
|
|
3 |
Exact Solutions of the Equations |
Plane and cylindrical Poisseuille flow, Couette flow |
Introduction to stability analysis for exact solutions |
|
4 |
The Potential Flow Approximation |
Spheres, cylinders and angles, streamlines, stagnation points |
Complex variable theory for 2D only in advanced topic |
|
5 |
Surface Waves |
Gravity waves, long gravity waves, droplet oscillations, introduction to solitons |
Derivation of Korteweg – de Vries equation for gravity waves, sech soliton solution |
|
6 |
Stokes’ Flow: Applications of Linearised Flow Equations |
Spheres and cylinders, Stokes’ law, simple solution sets |
Using transfer theorems to solve problems in reduced symmetry such as off centre cylinders |
|
7 |
Approximations with scale imbalances: Lubrication Theory and Boundary Layers |
Introduction to scale imbalance asymptotics, resolution of potential flow paradox |
Development of slender body theory in Stokes’ flow: driving flagellar motion |
|
8 |
Rayleigh – Bénard Convection |
Simplest description with spreadsheet based numerics |
Analysis of rectangular and hexagonal convection cells, stability of convection |
We describe three problems with the solution guide structure.
Example (i) Find the vorticity in the flows
v1(r) = 2V0z(1,0,0)/D and v2(r) = (P2-P1)(z2-D2/4)(1,0,0)/2hL
Consider why such a linear flow may have a vorticity. Can you write the velocity as the sum of a gradient and a curl? These are plane Poiseuille flows, one at constant pressure, driven by a shearing motion of the upper and lower bounding planes (a) and the other flow between two stationary planes, driven by a pressure difference (b). Students need to know what vorticity is and how to take the curl of a vector field. The narrative of the solution guides looks like this.
|
|
Way Points |
Level 2 Guides |
Level 3 Guides |
|
1 |
Vorticity of v1(r) |
Detailed construction of curl |
|
|
2 |
Vorticity of v2(r) |
Detailed construction of curl |
|
|
3 |
Specific
decomposition |
Theorems |
|
|
|
|
Gradient construction |
Specific case done |
|
|
|
Curl construction |
Specific case done |
|
|
|
Completion |
Interpretations |
Example (ii) Consider Couette flow when the outer cylinder is not rotating, but moving in the z direction with speed U while the inner cylinder rotates at angular velocity W. Can you reduce the equations to solvable form with any guessed functional dependence of the components of the flow velocity? Assume the pressure does not depend on z coordinate along the cylinders. What is the difference between the pressure in the fluid at the inner cylinder and the pressure in the fluid at the outer cylinder? The solution guide first recommends using a velocity of the form v = f(r)eq + h(r)ez. The waypoints and other guides are set out as
|
|
Waypoint |
Level 2 Guides |
Level 3 Guides |
|
1 |
Why use the suggested form |
Review other possibilities |
|
|
2 |
Reduce Navier Stokes’ with the suggested form |
Complicated reduction from cylindrical coordinates and show divergence zero |
|
|
3 |
Write down boundary conditions |
Derive boundary conditions |
|
|
4 |
Conclusions on angular dependence of pressure |
Integrate angle component of NS to force conclusions |
|
|
5 |
Solution for z component |
Derivation of Euler equations |
Introduction to solutions of Euler equations |
|
6 |
Solution for f(r) |
Derivation of solution |
|
|
7 |
Result for the pressure |
Integration of pressure equation |
|
Problem 3.4.3 Consider the flow of this section when the outer cylinder is not rotating, but moving in the z direction with speed U. Can you reduce the equations to solvable form with any guessed functional dependence of the components of the flow velocity? Assume the pressure does not depend on z coordinate along the cylinders. What is the difference between the pressure in the fluid at the inner cylinder and the pressure in the fluid at the outer cylinder?
Answers
LINK to full solution
If we have just the rotating inner cylinder, then the fluid velocity is v(r) = f(r)eq while if we just have the outer cylinder moving along the z axis, the fluid velocity is v(r) = h(r)ez . Thus we might expect a solution for the fluid velocity with both motions present to be of the form
|
|
(3A:3.4.3:L1:1) |
We must implement this solution and see if we can make it fit the equation of continuity and the Navier – Stokes’ equations as well as the boundary conditions.
Using the equation of continuity in cylindrical coordinates (see equation (A2.5)), show that this equation is satisfied by the velocity in equation (3A:3.4.3:L1:1)
LINK to Guide 1, level 2
With steady flow, so that time derivatives are zero, show that the Navier – Stokes’ equations (equation A2.8)) reduce to
|
along er |
|
(3A:3.4.3:L1:2) |
|
along eq, |
|
(3A:3.4.3:L1:3) |
|
and along ez , |
|
(3A:3.4.3:L1:4) |
LINK to Guide 2, level 2
What are the boundary conditions satisfied by f(r), h(r) and P (that is, for P, what happens when q increases by 2p ?
LINK to Guide 3, level 2
|
We may then find |
|
(3A:3.4.3:L1:5) |

LINK to Guide 4, level 2
We now turn to equation (3A:3.4.3:L1:3) and integrate it from 0 to 2p. This gives the equation
|
|
(3A:3.4.3:L1:6) |
and the result that P is a function of r alone.
LINK to Guide 5, level 2 We show this guide below as an example
We then have
|
|
(3A:3.4.3:L1:7) |
LINK to Guide 6, level 2
From the boundary conditions on f, we then find
|
|
(3A:3.4.3:L1:8) |
LINK to Guide 7, level 2
This completes the calculation of the components of the velocity. The pressure P(r) is then given by equation (3A:3.4.3:L1:2) as
|
|
(3A:3.4.3:L1:9) |
If we integrate this we obtain
|
|
(3A:3.4.3:L1:10) |
LINK to Guide 8, level 2
The pressure difference between the outside cylinder and the inside cylinder is then given by
|
|
(3A:3.4.3L1:11) |
LINK to Guide 9, level 2
The link to the 5th level 2 guide shows
We now turn to equation (3A:3.4.3:L1:3) and integrate it from 0 to 2p. This gives
|
|
(3A:3.4.3:L2G5:1) |
|
Thus we have the equation |
|
|
|
(3A:3.4.3:L2G5:2) |

and the result that P is a function of r alone. We obtain this by using the relation for f we have derived and integrating (3FA:3.4.3.7) with respect to q. The integrand is now zero, so from the equation, the integral is a function of r and z, but we already know that the pressure is independent of z. Thus the pressure is a function of r alone.
Equation (3FA:3.4.3.18) is known as an Euler equation with linearly independent solutions rq(+) and rq(-).
LINK to guide 1, level 3, this guide is shown below.
This link provides:
|
The equation |
|
|
|
(3A:3.4.3:L3G1:1) |
|
This is called an Euler equation whose general type is |
|
|
|
(3A:3.4.3:L3G1:2) |
|
We attempt to find a solution of the form f(r) = rQ. For this form of solution we have |
|
|
|
(3A:3.4.3:L3G1:3) |
|
If we put this into the differential equation (3A:3.4.3:L3G1:2), we obtain |
|
|
|
(3A:3.4.3:L3G1:3) |
This gives a quadratic equation for Q, with two solutions, giving two solutions to the Euler equation. If the two solutions to the quadratic are not equal, then the ratio of the two solutions of the differential equation is a non-zero power of r, which is not a constant. Thus the two differential equation solutions are linearly independent and the general solution of the Euler equation is a linear combination of the two power law solutions we have found.
This level 1 guide together with examples of level 2 and level 3 guides available within the level 1 guide gives some feel for the structure of the solution guide system, and also suggests the work necessary to provide such solution guides for roughly 75 problems in the whole subject.
Example (iii) Consider flow in a half space above a plane surface, which is rotating with angular speed W. Develop ordinary differential equations whose solutions describe the flow. Implement a simple numerical scheme in a spreadsheet or other numerical environment to describe the solutions. We illustrate this in the sample.
This is quite a difficult problem, its solution is due to von Karman and the solution requires a complicated ansatz about the nature of the components of the solution carried out in cylindrical coordinates. Thus the level 1 guide has a great deal more detail than in other examples. It starts with Von Karman’s (1921) scaling of variables, which is definitely not intuitive. In the talk we illustrate these ideas with explicit reference to the files.
|
|
Waypoints |
Level 2 Guides |
Level 3 Guides |
|
0 |
Description of scalings |
|
|
|
1 |
Boundary conditions |
Analysis of boundary behaviour |
|
|
2 |
First equation for reduced variables (Ñ×v = 0 ) |
Continuity equation reduction |
|
|
3 |
Second equation for reduced variables (r component) |
r component reduction for NS |
|
|
4 |
Third equation for reduced variables (q component) |
q component reduction for NS |
|
|
5 |
Fourth equation for reduced variables (z component) |
z component reduction for NS |
|
|
6 |
Restrictions on scaled variables |
Derivation of new boundary conditions |
|
|
7 |
Graph of calculated solutions and discussion |
Description of numerical procedures |
|
4 Some reflections
At the outset, it seemed that the layered solution scheme would produce rather similarly structured solution guides for almost all problems. That was not the case. With simple problems (see example (i)) the problem is to calculate something direct. The waypoints are the results. Level 2 guides show students how to derive the results. The remainder of this example was then a more extended question, which has a non-unique answer. The third level guides introduce a theorem and demonstrate applications. Example (ii) is a more extended problem. The level 1 guide leads the student through an assumed form for the velocity in the flow with waypoints derived in the attached guides. The complexity of the problem means it had to be broken into fairly simple pieces, so that level guides were not necessary. One third level guide developed some theory. The third example of section 3 is an extended problem that is really quite difficult. Thus the level 1 narrative leads the student closely, with fairly dense waypoints and guides. This meant that there was no need for deeper level guides. These examples show three different ways to give guidance.
The crucial element of this system is to give students complete control of when to call for help. An added advantage is that we can introduce somewhat harder problems than we might do onsite because we have help always available, at several levels. This is an important advantage of the system. At the same time there are some disadvantages. One is that the system may suppress creativity on the part of students who develop other ways of solution. That we can solve by careful maintenance of the subject, building in new techniques and solutions as students raise them. The other main disadvantage is the prodigious amount of work involved. I have no real answer to that except that with standard mathematics, change is very slow. The work can be amortised over several years. This is not, perhaps, the cheapest way to proceed with subjects who are advanced and developing rapidly.
References
Karman, T. von (1921) Z. angew. Math.Mech.,1, 233.
Landau, L.D. and Lifshitz, E.M. (1959) Fluid Mechanics. Pergamon, Oxford.
[J1] Don’t understand what this is